Author(s): Gagan Kumar Patra*, Chandrababu Kuraku, Siddharth Konkimalla, Venkata Nagesh Boddapati, Manikanth Sarisa, Shravan Kumar Rajaram, Mohit Surender Reddy and Kiran Polimetla
The use of customer evaluations as a basis for purchasing decisions has grown in importance with the meteoric rise of e-commerce in the last several years. Reviews provide businesses with valuable information and foster trust, in addition to helping potential customers make informed decisions. A comprehensive examination of a dataset including reviews from Amazon that spans many product categories was part of this research. This SA project's primary goal is to categorise Amazon reviews as neutral, negative, or positive using a BERT model. A study involves several key stages, including data preprocessing, collection, splitting, model training, and evaluation. The JSON-formatted reviews of items sold by Amazon were compiled, including devices like mobile phones, laptops, televisions, tablets, and video security systems. Preprocessing steps included lowercasing, removal of stop words, punctuation, contractions, tokenization, and part-of-speech tagging. Sentiment scores were generated using an opinion lexicon, and word embeddings were applied for numerical vectorization. Employing a cross-entropy loss function trained inside the PyTorch framework, a BERT model was used for sentiment categorisation. To measure how well the model performed, we employed evaluation criteria like recall, F1-score, precision, and accuracy. BERT achieved superior results compared to logistic regression and decision tree models, demonstrating its ability to capture long-term dependencies in textual data. Empowering e-commerce platforms to make educated judgements and expand their service offerings, these results have substantial practical consequences and will give them confidence in their strategy.
Over a last several decades, a popularity of online marketplaces has expanded, leading to a trend of requesting consumers for feedback on bought items in order to enhance the overall customer experience. Millions of evaluations of various products, services, and places are posted online every day [1]. As a consequence, information and views about goods and services may now be found mostly on the Internet. However, the abundance of product reviews and the variety of viewpoints to take into account could further muddle the decision-making process, creating doubt and confusion. After all, it's hard for buyers to make an informed decision when there are multiple opinions and ratings for the same product. This information should be evaluated by e-commerce companies in order to obtain feedback on their products and to help consumers make informed decisions [2].
For the next several years, sentiment analysis technologies will be important. We can distinguish between poor and excellent content using opinion processing. We can determine if a film gets more positive or negative reviews and why by using the technologies available today. A large fraction of the early research in this field focused on user input, such as reviews on Amazon.com which classified attitudes as neutral, positive, or negative [3]. Nowadays, most sentiment analysis research relies on social networking sites like Facebook, Twitter, and IMDB, which need appropriate techniques to meet text demand [4]. Comparatively speaking, it is challenging to analyse the language in cinema reports. Research Sentiment Mining is a procedure that uses information extraction (IE) or NLP to analyse a wide range of texts and gather various authors' points of view.
Many approaches are used in this process, including as IR and machine etymology [5]. Identifying and defining the polarity of text or brief communications is the cornerstone of sentiment analysis. Opinion polarity that is "negative," "impartial," or neutral is characterised. It is important to note that the following three steps are possible for emotion mining. 1) Sentence categorisation at the document level: at this point, a sentence may be completely categorised as "positive" or "neutral." 2) Sentences are to be categorised as either "yes, “no," or "unbiased."" 3) Sensitivity classification of dimensions or types of features: based on the elements of words or archives that are widely accepted as "view grouping of the viewpoint stage," statements or documents may now be categorized as "positive," "negative," or "non-party." [6,7]. The following Figure 1 shows the customer behavior during sentiment analysis.
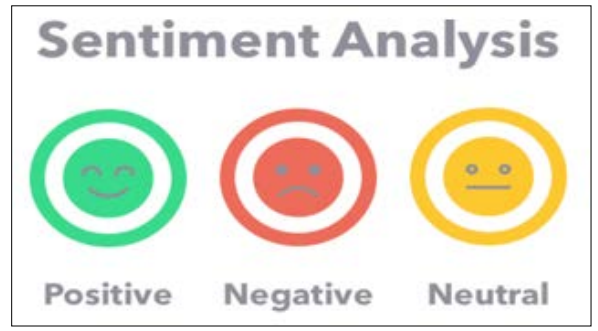
Figure 1: Customer Behavior during Sentiment Analysis
In recent years, ML methods have been more popular in the domains of semantic and review analysis. Amazon was ranked among the most popular online retailers in this research [8]. Hundreds of user reviews on the items may be read by prospective buyers [9]. With the information gleaned from these evaluations, buyers are better able to grasp the product's main characteristics. The end result is good for consumers, but it also aids businesses in better understanding what those consumers want [10].
To solve the sentiment classification issue for online reviews, this research used ML algorithms. The goal was to classify customer evaluations as positive or negative, as well as to find their overall relevance. Product evaluations found on Amazon were the source of the data. The goal was to categorise customer evaluations as either good or negative in order to determine their relevance.
The rationale for this research is derived from observation of the increase in online reviews in e-commerce. An aim of this study is to improve a performance of SA employing advanced techniques such as BERT and evaluate an impact of various text preprocessing methods on model accuracy. The motivation stems from the limitations of traditional models in understanding the complex contextual nature of language, particularly in customer reviews. By incorporating BERT’s contextual embeddings and analyzing preprocessing techniques, the study seeks to improve sentiment classification accuracy and provide insights into optimizing natural language processing workflows for better performance. The following are the research contributions in brief:
Here is the outline of the paper: Section I Introduction provides the background and context for the study. Section II Literature reviews relevant research and existing approaches. Section III Materials and Methods outlines an experimental setup and methodologies employed. Section IV Results and Discussion presents a finding, compares model performances, and discusses the implications of the results. Section V concludes with recommendations for further development.
Using methods like sentiment dictionaries and ML algorithms, this section reviews prior work on sentiment analysis. Moreover, although sentiment polarity classification and topic modelling have been applied, few studies approaches for more effective sentiment analysis.
In, created a fusion sentiment analysis approach that aims to mine online product experience by integrating textual analysis approaches with ML algorithms [11]. Then, to decide a reviewers' sentiment polarity, the SVM method is employed. On this basis, the LDA model extracts sentiment themes from reviews. Additionally, the lexicon is expanded using semantic similarity after prevent an omission of emotional information. Lastly, a method's viability and validity have been confirmed by research into customers' reading experiences of books on Amazon.com. A finding show that an approach successfully identifies emotional patterns in reviews and extracts factors impacting reading experiences.
In, focusses on the food business, and recommends a model that uses NLP techniques-TF-IDF Vectorizer and Count Vectorizer—to analyse consumer feedback. ML classification methods such as LR, dummy classifier, and RF classifier are utilized to forecast consumer sentiment based on these data [12].
In, work includes a performance-based evaluation of several classifiers by measuring classification accuracy in relation to mobile product data set size [13]. Using its analytical methodologies, the dataset was able to determine the categorisation accuracy; the dataset originated from the online stores of Amazon, Flipkart, and Snapdeal. The best approach is then determined by comparing the performance of four different classification algorithms, including NB, RF, DT, and SVM.
In, research intends to use an annotated dataset to apply Artificial
Basics (ABSA) to consumer evaluations of mobile phones in an effort to replace the current rating-based recommendation system with a more effective aspect-based one [14]. Multiple ML methods, like LR, NB, SVM, RF, KNN, and MLP, were used to confirm the dataset's correctness. With an accuracy of 67.45%, the MLP model constructed using the Keras Sequential API outperformed K-nearest neighbour, which attained an accuracy of 49.92%.
In, This study's objective is to identify an optimal method for our dataset by comparing the performance of present classifiers [15]. For this project, they queried the top Bangla e-commerce site, "Rokomari.com," for customer feedback. To evaluate the efficacy of ML and DL classifier models on this dataset, they built and tested them. The outcomes of the experiments show that in terms of accuracy, LSTM and SGD perform better than the other ML and based classifier models.
In, Study data pertaining to online clothing sales for women was taken from the Kaggle dataset, which contains 23486 user evaluations [16]. It is the goal of this study to compare and contrast how customers feel about purchasing online vs at a physical store. This research simulated ANN, SVM, and LR, three ML algorithms, and came up with an analysis in Python. If they compare the accuracy of SVM, LR, and ANN, they find that ANN achieves a higher rate of 88% than SVM (80%) and LR (75%).
Numerous researches have investigated sophisticated techniques for SA of customer evaluations in various industries. One solution involves combining textual analysis tools with ML algorithms to mine online product experiences. It uses SVM for sentiment polarity identification and LDA for topic extraction. Another study focuses on the food industry, analyzing customer sentiments through NLP techniques like TF-IDF and Count Vectorizer, and evaluating various classifiers including LR and RF. A third study assesses the performance of classifiers on mobile product datasets from multiple shopping websites, comparing NB, RF, DT, and SVM to determine the most effective method. Additionally, research on mobile phone reviews employs aspect-based SA and multiple ML techniques, finding that Multi-Layer Perceptron achieves the highest accuracy. Lastly, research on women's clothing e-commerce reviews compares a performance of SVM, LR, and ANN, with ANN showing superior accuracy. Together, these studies demonstrate how sentiment analysis methods have evolved and how different ML models work well in diverse e-commerce scenarios.
The creation and assessment of a sentiment analysis system for consumer product evaluations in the e-commerce industry based on ML is the goal of this project. Specifically, the study seeks to apply advanced ML techniques, such as the BERT model, to accurately classify reviews into neutral, positive and negative sentiments. A research methodology involves several key steps: The sources include Data Collection, where the JSON format of the reviews from Amazon are obtained from various categories; The Data Preprocessing, which comprises text transformations including lower casing and stop words, eliminating punctuations, tokenization whereby opinions are given scores based on an opinion lexicon together with a word embedding system for numerical conversion; Data Splitting whereby a data is divide into 70% for training, 10% for validation and a test set of 20%; After that employed BERT network that can handle long-term dependencies is trained and tested using the collected reviews with the help of PyTorch framework and employing cross-entropy loss function to enhance sentiment prediction accuracy. Figure 2 displays the suggested methodology's flowchart.
The datasets used to assess the suggested system are gathered from JSON file format evaluations found on the Amazon website. Every JSON file has several reviews in it. Reviews of computers, tablets, smartphones, TVs, and video surveillance equipment are included in the collection. The Table 1 provide the reviews per product category with counts.
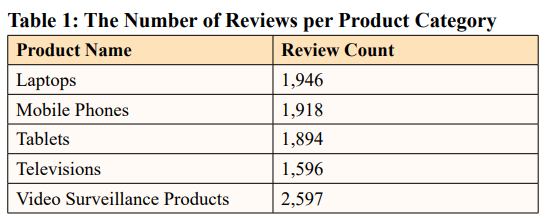
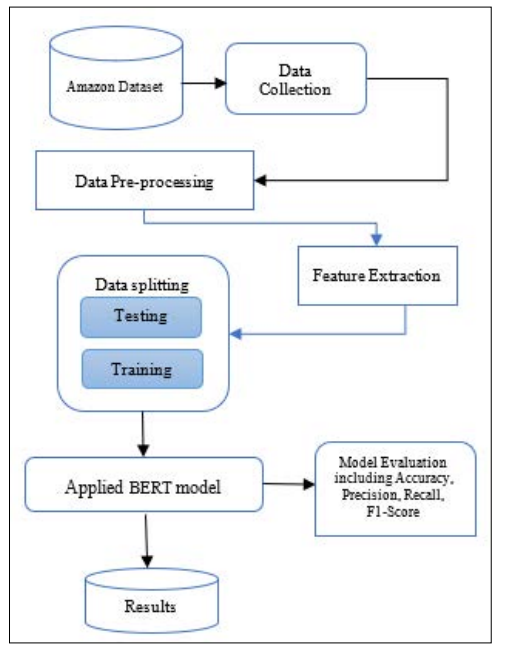
Figure 2: Methodology Flowchart for Sentiment Analysis
This section offers an overview of a planned sequential process for doing SA on Amazon reviews. The procedure has many steps, as shown in Figure 2.
In NLP activities, data preparation is essential for maximising the effectiveness of knowledge discovery. Raw data is prepared by computer preprocessing for further analysis. The steps of preprocessing are given below in detail:
An essential step in NLP is feature extraction, which involves converting raw text into a numerical representation that ML algorithms can easily comprehend. I have used BOW extraction strategies in my project.
The Bag-of-Words (BoW) method is essential in sentiment analysis because it converts textual input into a format that ML systems can understand [18,19]. To facilitate computer analysis, we reduce the linguistic complexity of reviews by portraying them as "bags" holding the word count without regard to order. The basis for our sentiment analysis algorithm is a technology that we developed to transform varied and unstructured consumer feedback into numerical vectors. In this research, the BoW technique is an effective tool that helps us measure the frequency of certain terms in reviews and identify significant trends. We want to analyse a large number of Amazon product reviews, and although it may not be able to detect delicate word correlations, it provides an easy and efficient technique to analyse large volumes of text, which will make it simpler to extract critical insights. Here is the first formula 1, for BOW:
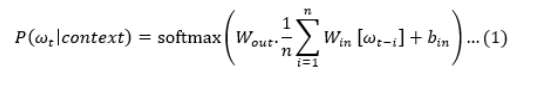
where:
The dataset, which included 13,057 product reviews, was split into 70%training, 10%validation, and 20%testing datasets during this phase. A review texts were detected and classified as positive or negative using the BERT models.
Classification is a method for organising data into different types. Data is classified into binary (such as "positive" and “negative") and ternary (such as "positive, “negative," and “neutral") categories using it in the area of SA. Then, a process of sentiment analysis is finished [20]. This study used approaches in sentiment classification of customers’ reviews as BERT model.
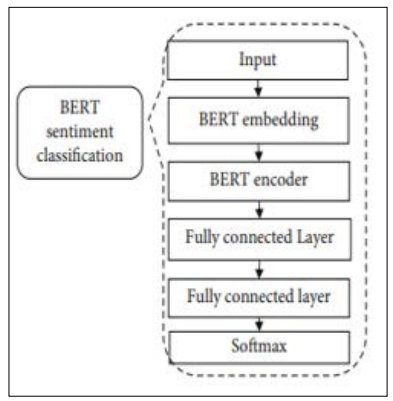
Figure 3: The Flow Chart of the BERT Model for Sentiment Classification
Figure 3 is a flow diagram depicting the BERT model's sentiment categorisation process. A segment-vector, word vector, and position-vector make up the BERT model's embedding layer. Three different embedding functions are used to convert vectors that represent words, segments, and locations. The location, segment, and word vectors all have 768 dimensions following the embedding procedure. Together, the values of the three vectors' corresponding dimensions provide an emotional document representation that incorporates word, segment, and position information. The pretrained model yields a word vector [21,22]. Elements of the segment vector may be either zero or one. When a sentiment document is less than the maximum sentiment length, a corresponding dimension is shown as 0, and when it is more than that, it is shown as 1 [23-25]. The word's location within the text is indicated by the position vector, which has a range of 1 to the maximum length. Filling the position vector with 255 indicates that the document is brief. Completely encoding the context's semantics is the 12-layer Transformer model that makes up BERT's encoder layer. To finish converting a hidden layer to a emotion category and a hidden layer to another hidden layer, behind the encoder model add two completely linked layers. The last step in the classification process is to determine the likelihood of every sentiment category using the softmax layer.
This section displays the dataset's visualisation outcomes together with the results of the most effective ML model for SA of Amazon product reviews. In order to assess how well machine learning models, work, we will use metrics like F1 score, recall, precision, and accuracy.
To get the most out of a dataset, exploratory data analysis (EDA) makes use of many charts to show and assess hidden data in rows and columns. Based on the sentiment score, this research examined the 3 review categories of positive negative, and neutral reviews on Amazon.
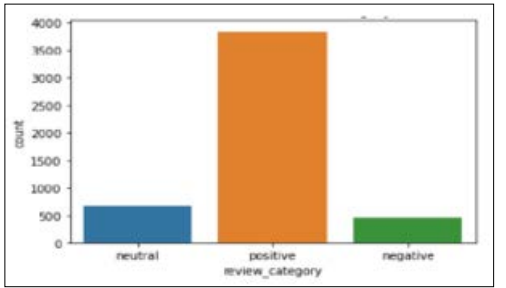
Figure 4: Distribution of Reviews' Categories
The Python Word Cloud program was utilized to visually display a text data according to review categories, as seen in Figure 4. The chart displays the most popular terms used in reviews, broken down by positive and negative sentiments.
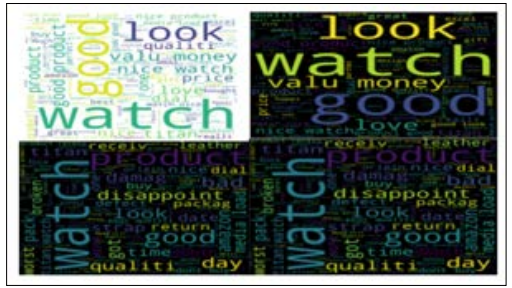
Figure 5: Most Common Words Used in the Reviews
Figure 5 is a word cloud that displays text data with a size of every word indicating its frequency or relevance. As a popular tool for analysing social network data, word clouds may draw attention to key passages within texts. For this analysis, researchers created word clouds to display the reviewers' most popular phrases.
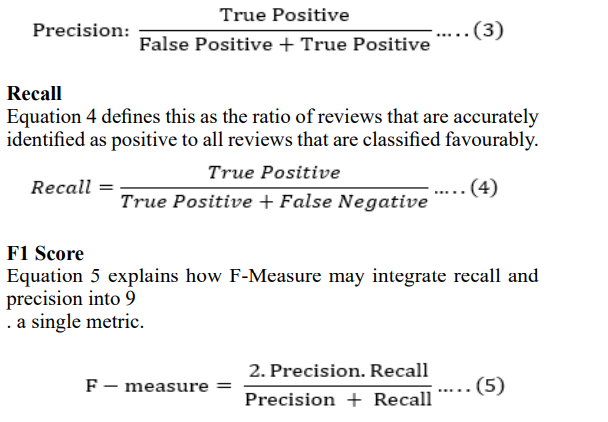
Metrics like recall, precision, accuracy, and F-score may be used to assess categorisation algorithms. When evaluating supervised ML algorithms, these parameters are quite helpful. Confusion matrix or contingency table data, which provides a detailed study of the model's performance according to TP, TN, FP, and FN, is the basis for their evaluation of a model's effectiveness [26,27].
According to equation 2, accuracy (A) is the ratio of accurately anticipated occurrences to all occurrences.
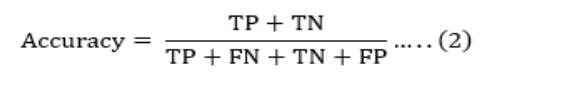
where TP denotes as True Positive, FP for False Positive, TN for
True Negative, and FN for False Negative. The study's models' accuracy findings are shown in Table I.
Equation 3 defines this as the ratio of reviews that are accurately identified as positive to all reviews that are actually favourably classified.
The BERT method's findings are analyzed and compared to the best literature approaches currently available. Common criteria or characteristics are used to analyze the system's overall efficiency.
All of the findings from our investigation will be reported in this section. The SA of consumer product reviews using the BERT model's following outcomes is covered below:
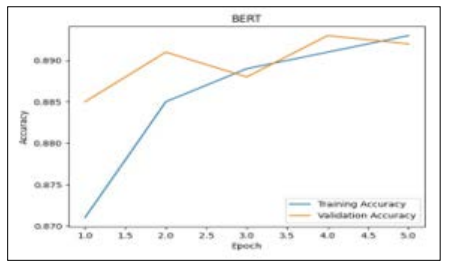
Figure 6: Plotting of BERT Accuracy Curve
The graph in Figure 6 illustrates the accuracy curve of a BERT model used for product review analysis. The blue line represents the training accuracy, while the orange line represents the validation accuracy, and both are shown over a span of five epochs. The Validation Accuracy varies considerably, but the Training Accuracy begins off high and stays there. The accuracy values range from approximately 0.870 to 0.890, indicating the model’s performance in predicting outcomes during training and validation phases. This graph is useful for seeing the BERT model's long- term performance in learning and generalising.
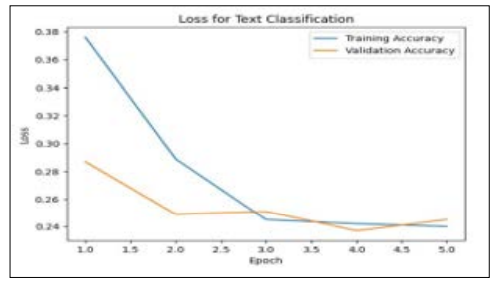
Figure 7: Plotting of BERT Accuracy Curve
The figure 7 illustrates the BERT loss curve for product review analysis. An x-axis illustrate an epochs, ranging between 0 and 5, while a y-axis shows a loss values, ranging from approximately 0.24 to 0.38. The Training Accuracy line starts at a higher loss value near 0.38 and decreases sharply, leveling off around epoch 3 near 0.26. The Validation Accuracy line begins at a lower loss value around 0.36, decreases more gradually, intersects with the Training Accuracy line between epochs 1 and 2, and fluctuates slightly above it after epoch 3. This indicates that the model is learning effectively, with the loss decreasing over time, though some overfitting might be occurring as the validation loss fluctuates.
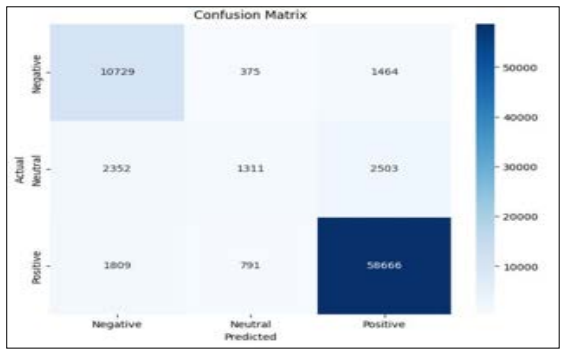
Figure 8: Confusion Matrix of BERT Model
Figure 8 displayed a confusion matrix, which illustrates how well the BERT model classified events into negative, neutral, and positive categories. While a model exhibits strong performance in predicting negative and positive instances, it struggles with neutral instances. For example, in the neutral class, the model has a high number of FP (2503) and FN (1311), indicating that it often misclassifies neutral instances as other categories. This indicates that the model might need some further work to increase its accuracy when it comes to neutral instance classification.
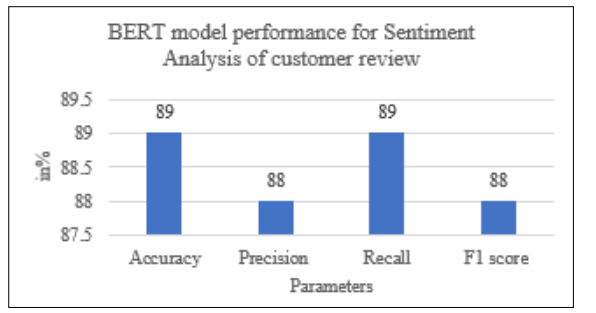
Figure 9: Performance of BERT Model for Customer Review
Figure 9 displays a performance of a BERT model with a following metrics: Accuracy and recall of 89%, while 88% precision and f1-score for product customer review sentiment analysis.
The following Table 2 provide the comparison between various ML models for the product review analysis based on BERT and other logistic regression and decision tree model.
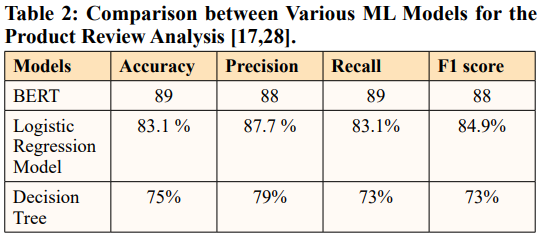
The comparison between various ML models for product review sentiment analysis reveals that the BERT model significantly outperforms both the logistic regression and decision tree models across all evaluation metrics. BERT achieved the highest accuracy 89%, precision 88%, recall 89%, and F1 score 88%, indicating its superior performance in capturing the sentiment nuances in customer reviews. In contrast, the LR model delivered an accuracy of 83.1%, with a precision of 87.7%, recall of 83.1%, and F1 score of 84.9%, demonstrating reasonably good performance but still lagging behind BERT. When it came to managing complicated text-based sentiment analysis, the decision tree model performed the worst with 73% recall, 75% accuracy, 79% precision, and an F1 score 73%. Compared to more conventional models, BERT outperforms them in sentiment analysis because of its superior capacity to represent textual data's context and long-term relationships.
The term "sentiment classification" (SC) refers to the job of sentiment analysis (SA), a branch of NLP that determines whether textual content suggests a favourable or unfavorable assessment. This study focusses on the several ML methods that are used to mine user reviews on Amazon items and analyse sentiments. This research effectively shows how the BERT model can analyse customer reviews for sentiment with a high degree of efficiency and accuracy. By applying advanced preprocessing techniques and leveraging a robust neural network, the model effectively classifies reviews into positive and negative categories. Based on the recall, F1 score, precision, and accuracy of 89%, a BERT model performs better than more conventional techniques such as LR and DT. As a consequence, it is a good option for sentiment analysis on big datasets. This research contributes to improving sentiment prediction accuracy for e-commerce platforms and enhances the understanding of customer feedback analysis.
While the BERT model demonstrates superior performance, it has limitations in terms of computational complexity and resource requirements, making it less efficient for real-time applications or large-scale datasets without significant infrastructure. Future work can explore optimizing the BERT model for faster inference, incorporating neutral sentiment classification, and extending the analysis to a wider range of product categories. Further research could also investigate hybrid models or fine-tuning techniques to enhance accuracy while reducing computational demands. Also can be used feature engineering, deep learning, class imbalance techniques that work with ML models.