Author(s): Miheretu Bedassa
This study was conducted to determine the effect of heavy metals (Pb, Cr, Cd, Fe, Cu, Zn, and Mn) contamination on soil physic-chemical properties around Mojo, Meki and Ziway farmlans area. The air dried soil was digested, using wet digestion method for heavy metals and physico-chemical properties of soil such as pH, electrical conductivity, cation exchange capacity, organic carbon, organic matter and particle size were determined. The levels of the heavy metals were determined using flame atomic absorption spectrometer. Applying statistical packages, analysis of variances and correlation between heavy metals levels and soil physic-chemical properties were evaluated.The pH values of the soil samples range from 8.09 - 8.34 which shows the soils of Mojo, Meki and Ziway are moder ately alkaline (8.4–7.9).The result show that pH is positively correlated with OC, CEC, Clay and Cd but negatively correlated with Cr, Cu, Zn, Pb, Mn, silt, sand and Fe.
Many studies have examined relationships among elements (major and trace) and between elemental concentrations and other soil properties (clay content, cation exchange capacity, pH, soil texture, carbonates) in non-contaminated soils. Methods of multivariate analysis have been widely used in these investigations to identify pollution sources and to apportion natural vs. anthropogenic contribution [2]. Heavy metals enter the environment by natural and anthropogenic means. Such sources include: natural weathering of the earth’s crust, mining, soil erosion, industrial discharge, urban runoff, sewage effluents, pest or disease control agents applied to plants, air pollution fallout, and a number of others [3]. Metals are present in the solid phase and in solution, as free ions, or adsorbed to soil colloidal particles. The heavy metal concentration in topsoil is a result of soil-forming processes, as well as agricultural and human activities. Heavy metals are currently of much environmental concern. These metals are dangerous because they tend to bioaccumulation in the food chain and they are harmful to humans and animals [4].
The rate at which heavy metals are accumulated in the soil depends on the physiochemical properties of the soil and the relative efficiency of crops to remove the metals from the soil. Heavy metals accumulated in cultivated soils can be transferred to humans through various exposure pathways causing adverse effects on human health [5]. Several factors may influence the content and distribution of heavy metals in soil. Some of these factors are parent material, organic matter, particle size distribution, drainage, pH, type of vegetation, amount of vegetation, and aerosol deposition. Greater quantity of Heavy Metals in soils has been testified to prevent plant’s progress in growth, uptake of nutrients, physiological as well as metabolic processes.
The Cr content of topsoil is known to increase due to pollution from various sources of which the main ones are attributable to industrial wastes such as Cr pigment and tannery wastes, electroplating sludge, leather manufacturing wastes, and municipal sewage sludge etc. Cr behavior in soil is controlled by soil pH and redox potential, while long term exposure to Cr can cause liver and kidney damage [7]. Many studies have examined relationships among elements (major and trace) and between elemental concentrations and other soil properties (clay content, cation exchange capacity, pH, soil texture, carbonates) in non-contaminated soils [1]. The aims of this study were: (i) to determine concentrations of seven heavy metals (Pb, Cd, Zn, Cu, Mn, Fe, and Cr) in soils of investigated area as a basis for future geochemical surveys; (ii) to determine the effect of heavy metal on soil physicochemical properties.
Description of the study area the study was carried at
Mojo (Lomeworeda, Dunguge village), Ziway (Adami Tulu
Jidacombolchawereda, Halaku-golba-boqe and Golbala-aluto villages) and Meki (DugdaWoreda, ShumiGamo village).
Mojo is located 80 Kms South of Addis Ababa, in Oromia Regional state, Ethiopia. It has a latitude and longitude of 8°39′N 39°5′E
with an elevation between 1788 and 1825 meters above sea level.
Ziwayis located on the road connecting Addis Ababa to Nairobi in the East Shewa Zone of the Oromia Region of Ethiopia. It has a
latitude and longitude of 7°56′N38°43′E with an elevation of 1643 meters above sea level.
Mekiis located in 140 km south from the capital city, Addis Ababa, Ethiopia. It has a latitude and longitude of 8°9′N 38°49′E / 8.150°N.
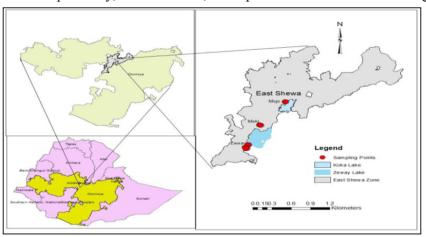
Figure 1: Location Map of the study area
Porcelain mortar, pestle and crucibles were used during pounding of the soil samples. Analytical balance (Sartorius analytic) was used to weigh the samples. Round bottom flasks with ground glass joint fitted with reflux condenser was used for digesting the samples on block digester heating apparatus. Borosilicate volumetric flasks (50 and 100 ml) were used during dilution of sample and preparation of metal standard solutions. Measuring cylinders, pipettes, and micropipettes (100-1000 μL) was used during measuring different quantities of volumes of sample solution, acid reagents and metal standard solutions. A metal concentration determination was done by flame atomic absorption spectrophotometer (FAAS) (Agilent Technologies, 200 Series AA) that used air-acetylene as fuel-oxidant mixture and that was equipped with deuterium background corrector and hollow cathode lamps.
Soil samples were analyzed for the following physicochemical parameters such as moisture content, pH, electrical conductivity, organic carbon, particle size and cation exchange capacity.
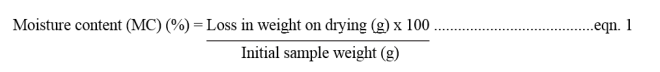
Soil moisture content was determined by oven drying method [7]. 10 g of soil sample was taken. The samples were oven dried at 105°C for 24 hrs. Dry weights of the samples were taken till it showed its constant weight. The loss in weight corresponds to the amount of water present in the soil sample. The formula below is used to calculate the percentage of moisture content in each of the soil samples [8].
The pH of the soil samples were measured in water suspension (1:2.5) soil to water ratio as described by [7]. Air dried soil of 20 g was taken in a beaker and 50 ml of distilled water was added. The mixture was stirred with glass rod for 10 min and allowed to stand for 30 min. The pH meter (HI9017, HANNA) was calibrated using standard buffer solution of pH 4.0, and 7.0. Then electrode of the pH meter was inserted in to the supernatant solution and the pH reading was taken.
The electrical conductivity (EC) of the soil samples was determined as described by [7]. Air dried soil of 20 g was taken in a beaker and to this 50 ml of distilled water was added. The mixture was stirred with glass rod for 10 min and allowed to stand for 30 minutes without any disturbances. The conductivity meter (4310 JENWAY) was calibrated using 0.01 KCl at standard 1413 μS/cm solution with K value 1.02. The soil was allowed to settle down and the EC value was measured inserting the electrode in to the supernatant solution.
The organic carbon content of the soil samples were determined by the method of Walkey and Black [9]. The results are calculated by the following formulas:

Where: N = Normality of ferrous ammonium sulfate (FAS) V1 = Volume of 0.5 N FAS required to neutralize 10 ml of 1 N K2 Cr2 O7 i.e. blank reading (ml). V2 = Volume of 0.5 N FAS needed for titration of soil sample (ml) S = Weight of air-dry sample (g) 0.39 = 0.003 x 100% x 1.31 (0.003 is the milliequivalent weight of carbon in g). It is assumed that only 77% of the organic matter is oxidized and a fraction of 100/77 (1.31). Organic matter (%) = Organic carbon (%) x 1.724. 1.724 = average content of carbon in soil organic matter is equal to 58%.
Cation exchange capacity is the total charge of the salts of cations in the soil. When soil sample is leached with 1.0 N NH4 OAc pH 7, all the cations are replaced by NH4+ is removed from the soil by distillation and collected in 2% Boric acid (H3 BO3 ). The ammonium is titrated with standard hydrochloric acid (HCl) [10].
The result was reported in Cmol (+)/kg soil and the CEC is calculated as
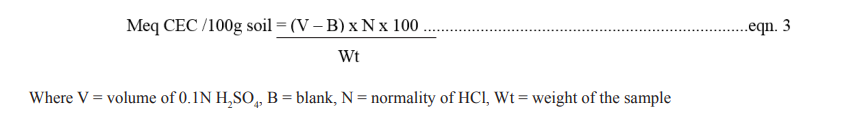
Where V = volume of 0.1N H2 SO4 , B = blank, N = normality of HCl, Wt = weight of the sample
Particle size analysis was done by Bouyoucos, G. H. method. The Calculation was done using the following formula [25].
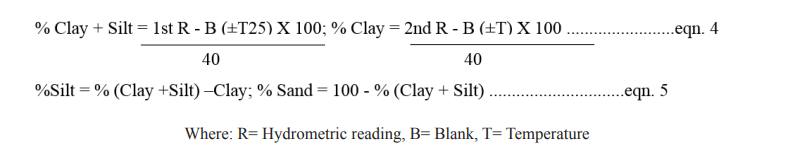
Where: R= Hydrometric reading, B= Blank, T= Temperature
Soil samples were digested according to [1]. To 0.5g of each of the air dried and sieved soil samples were thoroughly grinded, 1.0g of each of the ground soil samples were placed in block digester. 15 ml of 70% HNO3 , 70% H2 SO4 and 70% HClO4 mixture (5:1:1) of tri-acid were added and the content heated gently at low heat on block digester for 2 hrs at 800C and modification was taken on the temperature to 1500C for 2hrs until a transparent solution was obtained. After cooling, the digested samples were filtered using Whatman NO. 42 filter paper. It was then transferred to a 50 mL volumetric flask by adding distilled water.
Calibration curves were prepared to determine the concentration of the heavy metals in the sample solutions. Intermediate standard solutions (100 mg/L) of each metals were prepared from stock standard solutions containing 1000 mg/ L of Cd, Cr, Pb, Cu, Zn, Fe and Mn. Appropriate working standards were prepared for each of these metal solutions using dilution of the intermediate solutions using distilled water. According to the instrument operation manual to attain its better sensitivity and working standards were then aspirated one after the other into the flame atomic absorption spectrometry and their absorbance was recorded. Calibration curves were plotted with different points for each of these metals standard using absorbance against concentrations (mg/L). Immediately after calibration using the standard solutions, the sample solutions were aspirated into the FAAS instrument and direct reading of the metal concentrations were recorded.
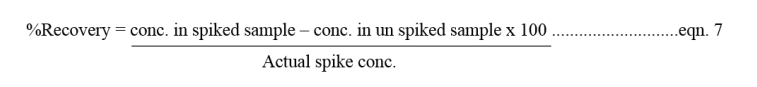
Recovery is one of the most commonly used techniques utilized for validation of the analytical results and evaluating how far the method is acceptable for its intended purpose. Because of the absence of certified reference material for the onion, water and their soil samples; validity of the digestion procedures were assured by spiking the samples with a standard solution of known concentration of the target analytes.
The spiking the pre-treated of soil sample was digested in triplicate following the same procedure used for digestion of the soil samples. The resulting digest of the spiked samples were then analyzed for their respective metal contents using FAAS and percent recoveries were calculated for the soil samples in triplicates.
The accuracy of an analytical method describes the closeness of mean test results obtained by the method to the true value (concentration) of the analyte. Accuracy was determined by replicate analysis of samples containing known amounts of the analyte. Accuracy was expressed as matrix spike recovery and the percent recovery results were calculated by the following equation [12].
The spiked samples will be then subjected to the same digestion procedure like the actual sample
The acceptable ranges of percentage recovery for the studied metals will be within 80-120% for metal analysis [12].
The precision of an analytical method describes the closeness of individual measures of an analyte when the procedure is applied repeatedly to multiple aliquots of a single homogeneous volume of sample matrix. Precision was expressed as relative standard deviation (RSD) of the three replicate results and the spiked samples were then subjected to the same digestion procedure like the actual sample [13]. The relative standard deviations (RSD) of the samples were obtained as
%RSD = (standard deviation/mean value) x 100 ....................................................................eqn. 8
Relative standard deviation is the parameter of choice for expressing precision in analytical sciences. The precision determined at each concentration level should not exceed 15% of the relative standard deviations (RSD).
Concentrations of chromium (Cr), cadmium (Cd), Copper (Cu), Zink (Zn), Iron (Fe), Manganese (Mn) and lead (Pb) in the filtrate of digested soil samples were estimated by using an Atomic Absorption Spectrophotometer. The instrument was fitted with specific lamp of particular metal. Working standard solutions of copper (Cu), zinc (Zn), Iron (Fe), Manganese (Mn), chromium (Cr), lead (Pb) and cadmium (Cd) were prepared from the stock standard solutions containing 1000 mg/L of element in 2N HNO3 . The instrument was calibrated with calibration blank and five series of calibration standard solutions, these solutions were diluted for desired concentrations to calibrate the instrument. Air-acetylene as fuel-oxidant mixture was used as the fuel and air as the support.
All the results of analysis were reported as mean ± standard deviation of triplicate measurements. The data was computed using Statistical Package for Social Science (SPSS) statistic 10.0 Microsoft window) for heavy metal analysis. The recorded data was subjected to analysis of variance (ANOVA), to assess the effect of vegetable type and site of production on the concentrations of heavy metal contaminant in the soil sample tested. As the level of heavy metal contamination might vary with sample collection site, one-way ANOVA was used to test the existence of significant difference between means. In all statistical analyses, confidence level was held at 95%.
In this study, the analytical wavelength, slit width, instrument detection limit and the correlation coefficients of the calibration curves for the determination of metals in the samples by FAAS are given in Table 1. The correlation coefficients of all the calibration curves were > 0.99 and these correlation coefficients showed that there was very good correlation (relationship) between concentration and absorbance.
Table 1: Analytical wavelengths, slit width, detection limits, correlation coefficients of the calibration curves for the determination of metals on soil samples by FAAS
| Metals | Wavelength (nm) | Slit width (nm) | Instrument Detection Limit(mg/L) | Conc. used for calibration curve (mg/L) | Correlation coefficient |
|---|---|---|---|---|---|
| Cr | 357.9 | 0.2 | 0.006 | 2, 4, 6, 8, and 10 | R2 =0.995 |
| Cu | 324.8 | 0.5 | 0.003 | 2, 4, 6, 8, and 10 | R2 = 0.999 |
| Zn | 213.9 | 1.0 | 0.001 | 0.3,0.6, 0.9, 1.2 and 1.5 | R2 = 0.995 |
| Pb | 217 | 1.0 | 0.010 | 2, 4, 6 and 8 | R2 = 0.998 |
| Mn | 279.5 | 0.2 | 0.002 | 2, 4, 6, 8, and 10 | R2 = 0.998 |
| Fe | 248.5 | 0.2 | 0.006 | 6, 12, 18, 24 and 30 | R2 = 0.997 |
The method validation was made by the spiking experiment in which known quantities of the metals standard solution were added to three samples which collected from sampling area for soil sample and applied the whole procedure to the mixture (spiked samples) and calculated the percent recoveries. The obtained percentage recovery varied from 80% to 120% in the soil samples which were in the acceptable range.
The reproducibility of the analytical procedure was checked by carrying out a triplicate analysis of un-spiked sample and calculating the relative standard deviations for each metal. The % RSD results did not differ by more than 10% of the mean which indicated that the analytical method used is precise and reliable (Table 2).
Table 2: Recovery test results for the metals determination in soil sample (mean ± SD)
| Concentration in soil sample (mg/L) | |||||
|---|---|---|---|---|---|
| Metal | un-spiked sample | spiked amount | Recovered amount | % Recovery Spiked amount | % RSD |
| Cr | 39.13 ± 0.32 | 6.00 | 44.61± 0.05 | 91.33 | 0.82 |
| Cu | 35.88 ± 1.81 | 4.00 | 39.47 ± 0.03 | 89.75 | 5.03 |
| Zn | 145.66 ± 4.22 | 0.9 | 146.51 ± 0.07 | 94.44 | 2.90 |
| Pb | 0.833±0.0789 | 4.0 | 0.833±0.0789 | 86.18 | 9.44 |
| Cd | 0.095±0.005 | 1.5 | 1.401 ± 0.08 | 87.07 | 5.26 |
| Mn | 1264.82±0.635 | 4.0 | 1268.97 ± 0.81 | 103.75 | 0.05 |
| Fe | 27427.33 ±1.527 | 12.0 | 274300 ± 0.93 | 102.42 | 0.01 |
RSD: relative standard deviation
Concentrations of metals in the soil collected from Mojo, Meki and Ziway farmlands in which vegetable was planted is given in (Table 3).
Table 3: Concentration of metals in soil samples with (mean ± SD), n=3
| Metals | Sites | U.A.EPA 1993 (mg/kg) max. con. |
||
|---|---|---|---|---|
| Mojo | Meki | Ziway | ||
| Cr | 39.13 ± 0.32a* | 18.37 ± 0.15b | 7.03 ± 0.10c | 3000 |
| Cu | 35.88 ± 1.81a | 32.80 ± 0.33a | 19.25 ± 3.29b | 4300 |
| Zn | 145.66 ± 4.22a | 153.30 ± 5.75a | 92.40 ± 7.86b | 7500 |
| Pb | 0.833±0.289 | ND | ND | 420 |
| Cd | 0.095±0.005 | 0.083 ±0.029 | 0.133 ±0.029 | 85 |
| Mn | 1264.82±0.635a | 1546.42±0.317b | 789.43±0.840c | 2000mg/kg (Itanna 2002. |
| Fe | 27,427.33±3.21a | 25,922.67±6.25b | 9,947.00±3.50c | 1500 mg/kg (FAO 1998) |
ND- not detected, *Means followed by different letters within the same row are significantly different at 5% probability level
The trend of concentration of metals in soil in descending order at Mojo (Fe >Mn>Zn > Cr > Cu >Pb> Cd), Meki (Fe >Mn> Zn > Cu > Cr >Cd) and Ziway (Fe >Mn> Zn > Cu > Cr >Cd). As can be seen from Table 3, Fe (27,427.33 ± 3.21 mg/kg) is the highest in Mojo soil compared to from Meki (25,922.67±6.25 mg/kg) and Ziway (9,947.00 ± 3.5 (mg/kg) Farms. This result indicated that concentration of Fe was above the allowable value (1500 mg/kg) [14]. This result agreed with [15] who reported the average concentration of Fe in the soil samples from banana land (AwaraMelka), orange, grape and guava land were 61, 600, 42, 300, 38, 800 and 26,800 (mg/kg dry soil) respectively. The concentrations of the metals vary from farms to farm and lands to land in which vegetables were grown. In this study the concentration of Fe, Mn and Cr in between Mojo, Meki and Ziway showed significantly different at p<0.05. Zn and Cu have no significant difference at p<0.05 between Mojo, Meki; but it showed significance difference with Ziway. The detection of Pb (Meki and Ziway) in soil samples were below detection limit. Except Fe, all the concentration of metals was below permissible level of (U.A.EPA 1993). The average concentrations of Mn in the soil samples were also below the allowable value (2000 mg/kg) [16]. The average concentrations of Mn at Mojo, Meki and Ziway were 1264.82, 1546.42 and 789.43 mg/kg dry weight respectively (Table3).
The results showed that there was lowest concentration of Cd in soil at Meki (0.083 ± 0.029 mg/kg) Farm compared to Mojo and Ziway Farm. The value was below the allowable level (85 mg/kg) (U.A.EPA 1993). The concentrations of Cu in the sampled soils were also below maximum allowable level (100 mg/kg) (2002).
The average concentration of Zn in soil samples was almost similar with orange land (130 mg/kg dry soil) and guava land (128 mg/kg dry soil). The same author reported that, average concentrations of Zn in banana and grape land are 111 and 114 mg/kg dry soil, respectively. In this study, in all cases the amounts of Zn in the soil samples were below the maximum allowable level (300 mg/ kg) [16]. The average concentrations of Pb in soil samples are detected in Mojo Farm compared to that of Meki and Ziway Farm. The values were below the maximum allowable level 420 mg/ kg (U.A.EPA 1993).
The concentrations of Cr in the soils of the study areas of Mojo, Meki and Ziway were 39.13 18.37 and 7.03 mg/kg respectively. These results were below the maximum concentration of permissible limits of 3000 mg/kg by (U.A.EPA 1993). The pH is one of the factors influencing the bioavailability and the transport of heavy metals in the soil, and Cr mobility decreases with increasing soil pH due to the precipitation of hydroxides, carbonates or the formation of insoluble organic complexes. In the present study, pH is negatively correlated with Cr and it was observed that the Cr concentration range from 7.03 - 39.13 mg/ kg was low as the pH range 7-8.5.
The average concentration of Cu in soil at Mojo (35.88), Meki (32.80) and Ziway (19.25) mg/kg. These results indicate below the maximum concentration of permissible limits of 4300mg/kg (U.A.EPA 1993).
The average Zn content in the cultivated soils from this experiment at Mojo, MekiamdZiway were found to be 145.66, 153.30 and 92.40 mg/kg respectively. This value is below the maximum permissible values of 7500 mg/kg by U.A.EPA 1993.
The fate and transport of Zn+2 in the environment is dependent on cation exchange capacity, pH, organic matter content, nature of complexing ligands, and the concentration of the metal in the soil. As pH increases, there is an increase in negatively charged binding sites on soil particles, which facilitates the adsorption of zinc ions and removal from solution. The Zn concentration in the soil and clay content are positively correlated [17]. In this study, clay is positively correlated with Zn and Zinc mobility increases with low pH (e.g. < 7) under oxidizing conditions and low cation exchange capacity. The presence of competing metal ions and organic ions such as humic material may cause the adsorption of Zn+2 ions to the soil, particularly in soils with an elevated pH, via ligand exchange reactions. These reactions reduce the solubility of zinc in the soil solution and, therefore, reducing its mobility and limit its bioavailability [18].
In the case of Pb, the concentration measured in the soil at Mojo was found to be 0.833 mg/kg in the respective cultivated soil. These values were below the (U.A.EPA 1993) recommended limit of 420 mg/kg. The concentrations of Pb at Meki and Ziway were not detected.
The average concentration of Cd in soil at Mojo, Meki and Ziway were 0.095, 0.083, and 0.133 mg/kg respectively. These result compared to maximum permissible limit of 85 mg/kg set by (U.A.EPA 1993), it was safe.
The average concentration of Mn in soil at Mojo, Meki and Ziway were 1264.82, 1546.42 and 789.43 mg/kg respectively. These result low when compared to reported by 2000 mg/kg [16].
The average concentration of Fe in all soil samples were higher in all site when compared to the recommended limit of 1500 mg/ kg set by [14]. These result correlated with the clay content of soil. There was higher clay content in higher Fe concentration; therefore,clay is positively correlated with Fe.
The concentrations of Cu, Cr, Zn, and Pb in soil samples are in the ranges that have been reported (U.A.EPA 1993). The values are below the maximum allowable level (420 mg/kg) (U.A.EPA 1993). Only the concentrations of Fe in soil samples were above the permissible level of 1500 mg/kg (Table 3) [14].
The mean concentrations of pH, electrical conductivity (EC), organic carbon, organic matter, cation exchangeable capacity and particle size analysis were as presented in Table 4. The average concentrations of pH at Mojo, Meki and Ziway were 8.34, 8.09 and 8.28 respectively. The percentage of organic carbon at Mojo, Meki and Ziway was 1.22, 1.45 and 1.63% respectively. CEC at mojo is the highest (49.87), as compared Meki (29.53) and Ziway (22.09) Cmol (+)/kg soil.
Table 4: Some physicochemical property of soil Samples (mean ± SD)
| Parameters | Sites | ||
|---|---|---|---|
| Mojo | Meki | Ziway | |
| pH | 8.09 ± 0.05 | 8.28 ± 0.75 | 8.34 ± 0 .53 |
| EC(μs/cm) | 776.33 ± 1.53 | 467.67 ± 1.15 | 774.00 ± 1.00 |
| % Moisture | 32.72 ± 2.05a* | 17.34 ± 2.59b | 17.15 ± 0.41b |
| % OC | 1.22 ± 0.11 | 1.45 ± 0.48 | 1.63 ± 0.36 |
| % OM | 2.10 ± 0.18 | 2.51± 0.83 | 2.82 ± 0.62 |
| CEC Cmol (+)/kg | 49.87 ± 1.02a | 29.53 ± 1.99b | 22.09 ± 2.87c |
| % Clay | 69.24 ± 1.50a | 35.75 ± 0.87b | 24.41 ± 1.61c |
| % Silt | 21.75 ± 1.80 | 38.42 ± 1.04 | 40.92 ± 2.57 |
| % Sand | 9.01 ± 0.51a | 25.83 ± 1.90b | 34.67 ± 4.07c |
* Letters of a, b and c represents of significant difference at 95% between the sites
The pH values of the soil samples range from 8.09 - 8.34 which shows the soils of Mojo, Meki and Ziway are moderately alkaline (8.4-7.9) Bruce and Rayment (Table 10) [24]. Therefore, the availability of the trace elements is low in soils of Mojo, Meki and Ziway Farms if only pH is considered. But availability of elements depends on other factors, therefore it is difficult to generalize that the availability of the elements in the soil are low. However, one can say that the pH of the soil may contribute for the decrease in availability of the elements. Shambel et al., reported the pH values of the soil samples range from 7.87 to 8.23 which shows the soils of Awara Melka and Nura Era Farms are slightly alkaline [15].
The soil’s ability to immobilize heavy metals increases with rising pH and peaks under mildly alkaline conditions. Heavy metal mobility is related to their immobilization in the solid phase. Fuller (Environmental protection agency, 1977), in discussing the relatively high mobility of heavy metals with regard to pH, considered that in acid soils (pH 4.2-6.6) the elements Cd, Ni, and Zn are highly mobile, Cr is moderately mobile, and Cu and Pb practically immobile, and in neutral to alkaline (pH 6.7-7.8), Cr is highly mobile, Cd and Zn are moderately mobile and. pH at which availability is reduced for Cu and Zn pH < 4.5 and > 8.0. Apart from pH, other soil properties, such as cation exchange capacity (CEC), organic matter content, quantity and type of clay minerals, the content of the oxides of iron (Fe), aluminum (Al), and manganese (Mn), and the redox potential determine the soil’s ability to retain and immobilize heavy metals. When this ability is exceeded, the quantities of heavy metals available to plants increase, resulting in the appearance of toxicity phenomena [19]. In this study, pH is negatively correlated with Cr, Cu, Zn, Pb, Mn, Fe, silt and sand.
Higher organic matter will have a higher cation exchange capacity (CEC) and higher water holding capacity than soil with a lower organic matter [20]. These studies agree with higher CEC the higher water holding capacity. On the other hand the higher CEC the higher moisture content. On Table 10 Mojo site is the highest CEC (49.87 Cmol (+)/kg soil) and moisture content (32.72) than the other site. The pattern concentration of CEC Mojo (49.87)>Meki (29.53) >Ziway 22.09 Cmol (+)/kg soil similar with moisture content Mojo (32.72) >Meki (17.34) >Ziway (17.15) %. The reason is that the order of clay content is similar with CEC and moisture content order Table 4.
The result of organic matter at Mojo, Meki and Ziway were 2.10 ± 0.18, 2.51± 0.83 and 2.82 ± 0.62 %. Reported the range of organic matter 1.70-3.00 is moderate [21]. Organic matter accumulates at the soil surface, mainly as a result of decomposing plant material. Whilst the organic matter content of soils is often small compared to that of clay, the organic fraction has a significant influence on metal binding. The mechanisms involved in the retention of metals by organic matter appear to include both complexation and adsorption, i.e. inner sphere reactions may take place as well as ion exchange [22]. The mobility of certain metals such as Mn, Zn, Cu and Fe investigated as affected by soil organic matter and its humic acid fraction revealed that the increasing concentration of soil organic matter caused a decrease while the increasing concentration of humic acid caused an increase in their mobility and that the mobility order was Mn> Zn > Cu > Fe [23]. In this study, organic matter is negatively correlated with Mn, Zn, Cu, Fe, Pb and Cr.
Cation Exchange Capacity (CEC) Cation Exchange Capacity (CEC) is the ability of soil solid phase to attract or store and exchange cation nutrients with the soil solution and them available to plants through exchange reaction (Muller-Samann and Kotschi, 1994). The CEC is an important parameter of soil because it gives an indication of the type of the dominant clay minerals present in the soil and its capacity to retain nutrients against leaching. The CEC is strongly affected by the nature and amount of mineral and organic colloids present in soil. Soils with large amount of clay and organic matter have higher CEC than sandy soil low in organic matter. Therefore, in this study CEC is positively correlated with clay and organic carbon.
ANOVA results showed that there were significant different (p< 0.05) in CEC and moisture content among the three sites. The range for CEC Very low < 6, Low 6-12, Moderate 12-25, High 25-40, Very high >40 CEC cmol (+)/kg [26]. The soil CEC result of Mojo, Meki and Ziway are in the range of very high 49.87, high 29.53 and moderate 22.09 Cmol (+)/kg soil respectively. The CEC of the soil samples ranged from 22.09 to 49.89 Cmol (+)/kg dry soil (Table 10). The CEC of Ziway is lowest compared to Mojo and Meki lands. CEC of soil from Mojo is highest (49.87 Cmol (+)/kg dry soil) compared to soil samples from other sites.
The pattern of soil particle size in decreases order Mojo clay > slit > sand, Meki silt> clay > sand and Ziway silt > sand >caly. Therefore, Mojo soil has very high clay content >50% with compared to Meki moderate 25-40% and Ziway low 10-25%. Clays are thought to adsorb metal ions through both ion exchange and specific adsorption. (Farrah and Pickering, 1977a) reported that the concentration of Fe and Mn tended to increase with increasing clay content of soil. The presences of hydroxides and oxides such as Fe (III), Mn (III/IV), Cr (III)/ (IV) are common in soils and sediments as suspended particles and as coating on clay mineral surfaces.
According to Rana and Kansal, the release of adsorbed Cd decreased with increasing pH, organic matter, CaCO3, CEC, and clay components and soils with high binding energy constant and adsorption maxima released smaller amount of Cd.
pH is positively correlated with OC, CEC, Clay and Cd but negatively correlated with Cr, Cu, Zn, Pb, Mn, silt, sand and Fe. As pH increases, there is an increase in negatively charged binding sites on soil particles, which facilitates the adsorption of zinc ions and removal from solution. The Zn concentration in the soil and clay content are positively correlated. This study is contradicted to [17]. The Cr content of topsoil is known to increase due to pollution from various sources of which the main ones are attributable to industrial wastes such as Cr pigment and tannery wastes, electroplating sludge, leather manufacturing wastes, and municipal sewage sludge etc. Cr behavior in soil is controlled by soil pH and redox potential, while long term exposure to Cr can cause liver and kidney damage [6].
Clay is positively correlated with CEC, Cr, Cu, Zn, Pb, Mn and Fe, but silt, sand and Cd.
Table 5: CorTrelation ship between heavy metal and soil physic-chemical properties
| pH | OC | CEC | Clay | Silt | Sand | Cr | Cu | Zn | Pb | Cd | Mn | Fe | |
|---|---|---|---|---|---|---|---|---|---|---|---|---|---|
| pH | 1 | ||||||||||||
| p-value | 0 | ||||||||||||
| OC | 0.976 | 1 | |||||||||||
| 0.141 | 0 | ||||||||||||
| CEC | 1 | 0.982 | 1 | ||||||||||
| 0.019 | 0.122 | 0 | |||||||||||
| Clay | 1 | 0.979 | 1 | 1 | |||||||||
| 0.009 | 0.132 | 0.01 | 0 | ||||||||||
| Silt | -0.994 | 0.945 | -0.99 | -0.992 | 1 | ||||||||
| 0.071 | 0.212 | 0.09 | 0.08 | 0 | |||||||||
| Sand | -0.994 | 0.994 | -1 | -0.995 | 0.9746 | 1 | |||||||
| 0.073 | 0.068 | 0.054 | 0.064 | 0.1437 | 0 | ||||||||
| Cr | -0.992 | -0.995 | 0.996 | 0.994 | -0.972 | -1 | 1 | ||||||
| 0.079 | 0.062 | 0.06 | 0.07 | 0.1499 | 0.0063 | 0 | |||||||
| Cu | -0.802 | -0.914 | 0.819 | 0.81 | -0.73 | -0.865 | 0.8696 | 1 | |||||
| 0.408 | 0.267 | 0.389 | 0.399 | 0.4787 | 0.3351 | 0.3288 | 0 | ||||||
| Zn | -0.597 | -0.759 | 0.621 | 0.608 | -0.504 | -0.685 | 0.6918 | 0.9581 | 1 | ||||
| 0.593 | 0.452 | 0.574 | 0.584 | 0.6636 | 0.5199 | 0.5136 | 0.1848 | 0 | |||||
| Pb | -0.973 | -0.899 | 0.966 | 0.97 | -0.993 | -0.941 | 0.9374 | 0.6431 | 0.397 | 1 | |||
| 0.148 | 0.289 | 0.167 | 0.156 | 0.0765 | 0.2202 | 0.2265 | 0.5553 | 0.74 | 0 | ||||
| Cd | 0.5 | 0.678 | -0.53 | -0.512 | 0.4003 | 0.5953 | -0.603 | -0.918 | -0.993 | -0.288 | 1 | ||
| 0.667 | 0.526 | 0.648 | 0.658 | 0.7378 | 0.5941 | 0.5878 | 0.259 | 0.074 | 0.814 | 0 | |||
| Mn | -0.37 | -0.565 | 0.397 | 0.383 | -0.264 | -0.473 | 0.4816 | 0.8516 | 0.966 | 0.146 | -0.99 | 1 | |
| 0.759 | 0.618 | 0.74 | 0.75 | 0.83 | 0.6863 | 0.6801 | 0.3513 | 0.166 | 0.907 | 0.0923 | 0 | ||
| Fe | -0.74 | -0.87 | 0.76 | 0.749 | -0.661 | -0.812 | 0.8175 | 0.9953 | 0.981 | 0.566 | -0.952 | 0.899 | 1 |
| 0.47 | 0.329 | 0.451 | 0.461 | 0.5407 | 0.397 | 0.3907 | 0.0619 | 0.123 | 0.617 | 0.1971 | 0.289 | 0 |
Variations in the mean levels of metals between the samples were tested whether it was from just a random error or treatment (i.e. difference in mineral contents of soil) using one way analysis of variance (ANOVA). Significant differences were obtained (p< 0.05) at 95% confidence levels for Zn, Mn, Fe and Cr in soil at Mojo, Meki and Ziway. However, the variations for Pb in soil Cu, and Cd were not significant different (p< 0.05) in the samples at the area.
In this study soil samples were analyzed for the concentration of heavy metals (Cu, Zn, Cr, Fe, Mn, Pb and Cd). pH is positively correlated with OC, CEC, Clay and Cd but negatively correlated with Cr, Cu, Zn, Pb, Mn, silt, sand and Fe. The concentration of iron determined in the soil samples were found above the permissible limit in the three areas. The pH of the soil was moderately alkaline in the three sites. One-way ANOVA revealed that there was significant difference (p< 0.05) in levels of Cr and Fe in the soil samples at the three sites respectively.