Author(s): Harit Kasana, Harish Chander and Ashwani Mathur*
The significance of expression systems for quickly creating enough numbers of therapeutic monoclonal antibodies to make them available to patients has been heightened in recent years due to advances in the creation of genetically modified monoclonal antibodies. The conventional method for making recombinant proteins involves first cloning the desired gene into an expression vector, and then testing how well it expresses itself in cells. For cellular expression and perpetuation, a plasmid containing the chosen genes is then cloned. The most significant and lucrative subset of biopharmaceuticals is monoclonal antibodies (mAbs). To temporarily produce an anti-CD20 monoclonal antibody in mammalian cells, this work created and assessed an anti- CD20 mAb expression construct. The gene fragment was transferred to the expression vector after the vector (pcDNA3.1+) was synthesised by sequentially cloning the Light Chain (LC) and Heavy Chain (HC). We co-transfected HEK 293 cells and then examined the cell culture supernatant for antibody clone expression. Using this technology to transiently express the whole monoclonal antibody in mammalian cells was a breeze, and our findings prove it.
Monospecific antibodies, also known as monoclonal antibodies (mAb), may bind to a specific epitope [1]. The B cells that produce these antibodies are homogeneous hybrids, meaning they are all clones of the same parent cell. Research has shown that therapeutic recombinant monoclonal antibodies may repair, strengthen, or imitate the immune system’s assault on cancer cells. These lab-produced molecules are tailored to function as replacement antibodies. Their purpose is to attach to antigens, which are often more abundant on cancer cells’ surfaces compared to healthy cells [2]. When it comes to approvals and sales, monoclonal antibodies (mAbs) still rule the biopharmaceutical business, and they’ve grown into a major class of biopharmaceutical products [3]. They include some of the best-selling medications and constitute the most lucrative category of products overall.
Improvements in antibody manufacturing have been substantial over the past few decades, thanks to the increasing need for monoclonal antibodies (mAbs) for medicinal purposes. Host cells that can natively fold and alter the mAb are required for antibody synthesis because of the antibody’s more complicated structure. The reduction of their immunogenicity is one of the many functional features made possible by modifications, one of which is
post-translational glycosylation [4]. Because of their specific roles as hosts for antibody synthesis, mammalian cells are ideal for this task [4,5]. The use of suspension cell lines that can grow at high densities and have higher production yields has been enhanced due to advances in cell engineering and transfection protocols [6,7]. While later phases of drug discovery and development include creating stable cell lines from the most promising candidates, early stages use transient transfection to produce research amounts of mAbs, which are enough for characterising lead candidates [8]. Transient expression is a cost-effective and efficient technique for early drug discovery since high-efficiency transfection reagents are readily accessible on the market and disposable materials are used. Because of their human-like glycosylation patterns and excellent expression yields, HEK293 and CHO cells are often used for transient antibody production [10,11].
There are 130 therapeutic mAbs available on the market, with 45 of them being used for cancer treatment, and at least 570 of those are in development or clinical trials by commercial companies around the world [3,12]. Treatment has been transformed by anti-CD20 monoclonal antibodies. In the last quarter of a century, monoclonal antibodies (mAbs) have surpassed all other therapy modalities for a wide range of disorders, highlighting the growing significance of therapeutic mAbs [13]. During this period, significant technical advancements have facilitated the rapid and efficient discovery and development of mAb therapeutics. Many blood cancers affecting B cells and have established themselves as the norm in contemporary medicine. Furthermore, these drugs have been used in the therapy of several autoimmune illnesses due to their strong ability to deplete the B cell compartment. A few of these medicines have undergone extensive research and are now commonly utilised in clinical settings [14].
CD20 is a surface phosphoprotein that is not glycosylated and is present on the majority of B lymphocytes, both healthy and cancerous. The protein CD20 is not present on precursor B cells, but it does emerge throughout the B cell maturation process and is eventually removed from plasma cells once they have completely differentiated [15]. Several structural and expression-related features support CD20’s appeal as a therapeutic target. The fact that CD20 expression is almost always present in advanced B cell lymphoid cancers is one of the main reasons why it is attractive as a potential therapeutic target. Importantly, CD20 expression levels on cancerous B cells are relatively constant compared to normal B cells. This, along with the fact that CD20’s extracellular epitope components are close to the cell membrane, makes it a promising therapeutic target, especially for complement-mediated killing and antibody-dependent cellular cytotoxicity (ADCC). Such a wide array of features that are conducive to antibody binding is seen in only few antigens [15,16].
When it comes to the influence on treatment paradigms, few contemporary medical breakthroughs can compare to the creation of monoclonal antibodies targeting CD20. The words “pre-rituximab era” and “rituximab era” are prevalent in the vocabulary of haematology and oncology [17]. Due to the fact that anti-CD20 treatment has ushered in a new era, especially in the management of B cell malignancies. A cornerstone of the care of B cell lymphoma is targeting CD20, even if its exact physiological function is still not fully understood. Targeting CD20 is a very successful way to deplete the B cell compartment. In addition to cancer, inflammatory and autoimmune illnesses are significant targets for anti-CD20 treatments [18].
To temporarily produce an anti-CD20 monoclonal antibody in mammalian cells, this work created and assessed an anti-CD20 mAb expression construct. The gene fragment was transferred to the expression system after the vector (pcDNA3.1+) was synthesised by sequentially cloning of the light chain (LC) and heavy chain (HC). The HEK 293 cells were co-transfected and the cell culture supernatant was used to evaluate antibody expression.
The Heavy and light chain amino acid and nucleotide sequence of rituximab obtained from literature source viz. patent etc is aligned with the sequence obtained from Drug bank and other sources using BLAST (The program compares nucleotide or protein sequence and calculate statistical significance) [19,20]. Based on analysis the sequences have been finalized and validated. Further the cloning strategy has been planned with appropriate restriction sites and incorporating the signal sequence.
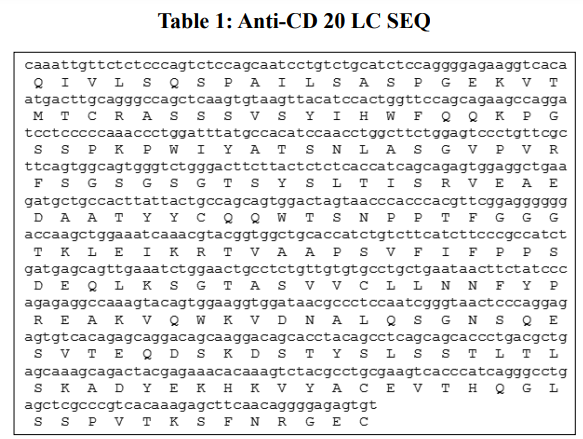
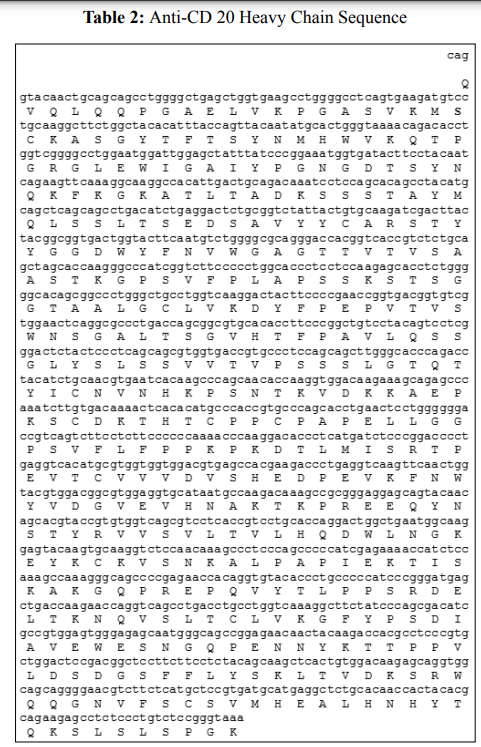
The coding sequences for the light chain (LC) and heavy chain (HC) were synthesised separately and cloned into the pcDNA 3.1 (+) vector in order to generate an expression vector. These two constructs were made available by Genscript.
Human Embryonic kidney cells (HEK293) cell lines were used for the expression. In order to create the HEK293 cell line, sheared adenovirus type 5 DNA was introduced into human embryonic kidney cells. Subsequently, other subcategories and variations have been developed, including HEK293, HEK293-T, and HEK293-F, which are commonly employed in the manufacturing of biopharmaceuticals [1,2]. The cells were grown in a controlled environment with 5% CO2 and 37 °C. The medium used was RMPI 1640, which included 2 mM L-glutamine, 0.1 mg/mL penicillin/streptomycin, and 10% foetal calf serum. The incubator was made by ThermoFisher Scientifc of Dreieich, Germany.
This DNA was Co-transfected in human embryonic kidney (HEK293) cell lines. Transfection was performed using Lipofectamine, here, 24 hours before the transfection, six lakh cells were seeded on six well plates and kept at 37°C in a 5% CO2 incubator, and confluence was checked another day. Moreover, in the transfection, 12 µl of lipofectamine was added to 250 µl of minimum essential medium (MEM) (without FBS) and kept at room temperature for 5 min. Later, 4µg DNA with 250 µl MEM (without FBS) was added to 12 µl lipofectamine with 250 µl MEM and kept for 20 min. DNA and lipofectamine complexes were made in a 1:3 ratio. The complexes were put to a six-well plate after removing the media and replacing it with MEM media. Currently, the cells are subjected to the addition of DNA and Lipofectamine mixtures in a gradual manner, with each drop being carefully introduced. The next step is to gently turn the plate to mix the cells. The next step is to place the plate in an incubator with 5% CO2 and keep it there overnight at 37°C. On the next day, 1ml of MEM medium lacking Foetal Bovine Serum (FBS) is once again introduced to the cells. The six-well plates are then returned to the incubator, maintaining the same conditions, for a duration of 6 hours. Following this time frame, the liquid portion that floats above the sediment is gathered. The target protein’s expression is examined using techniques like SDS-PAGE and Western blotting.
The current investigation used a 4% stacking gel and a 12% resolving gel to compose an SDS gel. Acrylamide (30%), Tris HCl (1.5 M), APS (10%), TEMED (10%), SDS (10%), and another
10% were used to make the gels. Initially, clean both the sensitive glass plate and the spacer plate. Following that, firmly assemble them onto the supporting frame, and check for any potential leaks by conducting a water test. Afterwards, add the necessary components for the resolving gel into a clean 10 ml vial as described above. Using a micropipette, carefully transfer the gel mixture between the glass plates, enabling it to undergo polymerization. Subsequently, prepare the stacking gel in a separate sterile 10 ml vial and carefully place it on top of the polymerized resolving gel. Place a four well comb with a thickness of 1.0 mm into the gel matrix without causing any disruption. After the gel has undergone polymerization, cautiously remove the comb. Later, electrophoretic analysis was conducted, and the expected protein (marker) was added in the last well. Subsequently, 10 µl of the sample mix with 2 µl of SDS loading buffer (6X concentration) and boil the mixture at 95°C for 5 minutes. Place this pre-prepared sample together with a molecular weight marker (particularly, the ‘Sigma Colour Burst’ protein marker range: 6.5 to 66 kDa) into the wells of the gel. For 40 minutes, the electrophoresis was run at a constant voltage of 200 V.
Here, to perform a Western blot, the Western blot cassette is initially assembled with a moistened nitrocellulose membrane, Whatman filter sheets, and sponges placed alongside. The nitrocellulose membrane is then placed on the gel, and the gel and nitrocellulose membrane are sandwiched between stacks of moistened Whatman filters. It is ensured that the gel faces the black side (cathode) and the nitrocellulose membrane faces the white side (anode). The tank is filled with western transfer buffer, and the cassette is inserted into the transfer tank. A power supply of 110 V is applied for a duration of 90 minutes. After the transfer, the nitrocellulose membrane is gently extracted, and Ponceau stain is applied to facilitate the visualization of bands corresponding to the anticipated molecular weights. The membrane is then rinsed with water, blocked with 10% skimmed milk, rinsed with 0.1% 1X TBST, and the primary antibody (goat anti-human IgG) is introduced, followed by incubation. After another rinse, the secondary antibody (ALP conjugated anti-goat antibody) is introduced, followed by another rinse. The blot is then initiated with substrate (NBT/BCIP), dried, and observed.
The coating procedure was let to proceed overnight at 40°C on a Nunc ELISA maxisorp micro-titer plate with a concentration of 250ng/well of Goat Anti-Human gamma chain-specific antibody (SIGMA# I3382) in 1X PBS. The next step was to take the plate out of the fridge and put it in an incubator set at 37 degrees Celsius for an hour. The standard antibody was diluted in PBST containing 1% BSA in a range of concentrations from 100 ng/ml to 1.5 ng/ ml. After that, the plate’s contents were shaken off, and 300 μl of 1% BSA in PBST was added to every well to block it. The wells were then left at 37°C for one hour. The plates were dried on a tissue bed after the blocking buffer was flicked off. Then, they were rinsed three times with wash buffer (0.05% PBST) and dried again. Except for the blank wells, which served merely as media controls, all of the other wells were filled with standard dilutions and test samples. After an additional hour of incubation at 37°C, the plates were washed three times with the wash buffer and then dried on a tissue bed. Each well was incubated at 37°C for one hour after being diluted 1:100000 with goat anti-human Kappa (SIGMA #A7164) horseradish peroxidase-labeled secondary antibody (in 1% BSA in PBST). Each well was supplemented with 100 μl of substrate after five washes with wash buffer (0.05% PBST) and three washes with PBS. Prior to reading the absorbance at 450 and 620 nm using the ELISA plate reader, the plates were left to incubate in darkness for 30 minutes. To terminate the reaction, 100 μl of 1N H2SO4 was added to each well.
There are often many processes involved in the purification process of a monoclonal antibody (mAb). These include viral clearance, final formulation, purification, intermediate purification, polishing chromatography, and bulk drug substance (BDS) filtering. The antibodies were purified using affinity chromatography, which made use of protein A and protein G columns. The Fc region of the antibody is specifically targeted by the protein A and G. Subsequently, the foundation of IgG purification is formed by protein A and protein G. The GE AKTA FPLC System was used to perform purification. Hi Trap protein A FF1 x 5ml column was used. Here, the supernatant underwent centrifugation at 2500g for 10 minutes to eliminate lipids and cell debris, and then was pre-filtered using a 6–40µ filter then passed through a 0.45 µ filter [21,22].
The equilibration and wash buffer used is PBS at a pH of 7.4, while the elution buffer consists of a 0.3M glycine solution at pH 3. The neutralization step employs a Tris buffer with a concentration of
1.5M and a pH of 8, and regeneration of the column is achieved with 1M acetic acid. Initially, the column is equilibrated with five column volumes (CV) of PBS to establish the binding conditions. Following equilibration, the sample is applied to the column to commence the loading process. The column is washed with 5 to 10 CV of PBS buffer to remove contaminants and unbound materials. This process is repeated until the eluate does not contain any protein. Bound proteins are then eluted using 5 CV of the glycine buffer. After elution, the column is regenerated by passing 10 ml of 1M acetic acid through it, and immediately re-equilibrated with 5 to 10 CV of PBS, preparing it for future applications.
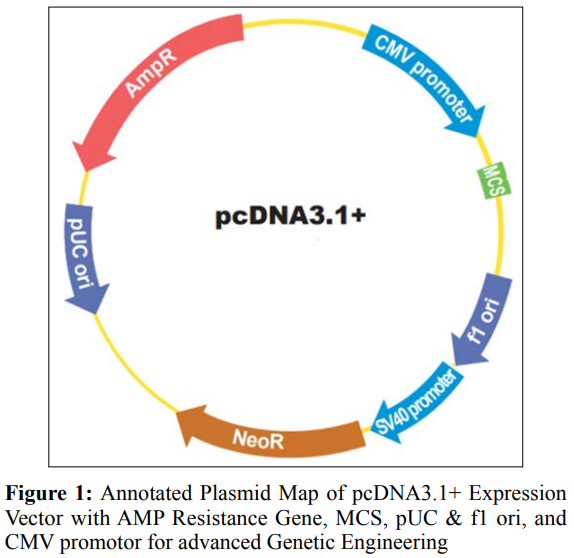
Monoclonal antibodies (MAbs) are a kind of antibody that may bind specifically to one epitope. B cells, which are clones of one parent cell, are responsible for producing these antibodies [23]. To enhance the immune system’s capacity to target cancer cells, recombinant monoclonal antibodies are synthetic molecules developed to function as substitute antibodies. These substances are specifically created to attach themselves to antigens, which are typically found in higher amounts on the outer layer of cancer cells compared to healthy cells [24]. Moreover, constructing recombinant vectors and producing MAbs enables researchers to investigate the interaction between MAbs and antigens that are particular to malignancy. This can result in the discovery of new therapeutic targets on cancer cells, which can help in the advancement of novel medicines. The plasmid map of pcDNA3.1+ expression vector is given in Figure 1.
The coding sequences for the light chain (LC) and heavy chain (HC) were synthesized separately (Table 1&2) and cloned into the pcDNA 3.1 (+) vector in order to generate an expression vector.
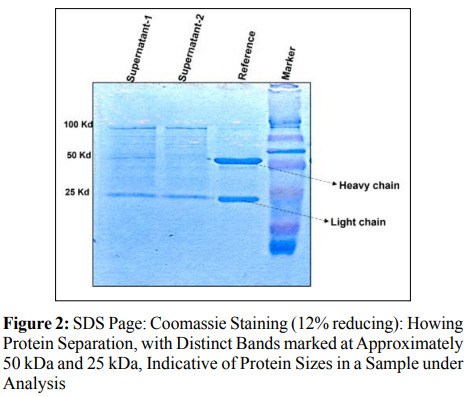
The expression of monoclonal antibody was analyzed using various method including SDS-PAGE, Western blotting, and ELISA.
In the SDS analysis, lipofected supernatants 1 and 2 were added in wells 1 and 2, respectively, and in well 3, control (Reference) was added, followed by marker in well 4. As an outcome, lipofected 1 showed a faint band of 50 and 25 kD, while the lipofected supernant sample 2 in lane 2, 25 kD band is more visible, though the 50 kD band is non-visiable as shown in Figure 2. This suggested that the liopfected 1 has the presence of the targeted protein and in lipofected 2 the concentration is too low to detect.
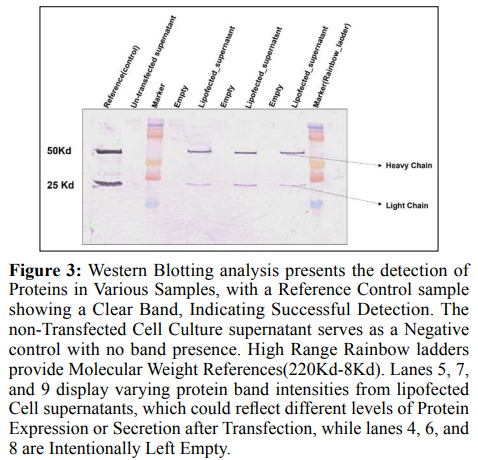
Western Blot
Western blotting is the process to identify the specific protein for the complexes or from the mixtures of the proteins. This approach separate the proteins by their size and the molecular weight [25]. In Figure 3 the presence of a clear band in the Reference control lane confirms the reliability of the detection system. The absence of bands in the non-transfected cell culture supernatant indicates that the protein of interest is either not naturally present in these cells or is present at a level that is too low to be detected by this assay. The High Range Rainbow ladder lanes clearly indicate the molecular weights of the proteins in the neighbouring samples, which is crucial for assessing the size of the identified proteins. The well 4, 6, and 8 are the empty lanes, consisting function as buffers to prevent the mixing of substances and to guarantee distinct separation of bands. The different strengths of bands observed in wells 5, 7, and 9 of the lipofected cell supernatants may suggest the synthesis of the desired protein after transfection, and the size of the identified protein was 25 Kd and 50 Kd. The bands observed in these lanes indicate that the lipofection process has successfully introduced one or more genes that are being actively expressed, resulting in the secretion of the corresponding protein into the supernatant. In summary, the Western blot analysis indicates that the transfection effectively stimulated the production of the desired protein in the lipofected cells. This is evident from the appearance of distinct bands in the lipofected samples, similarly, the control sample (which was not transfected) showed these bands.
The concentration of was quantified for eight samples using an ELISA test. The quantification was performed throughout a standard concentration range of ng/ml, using a 24-well plate format.
A standard curve was established using known standards, with a linear relationship observed between the natural logarithm of the concentration and the average OD measurements (R² =, p < 0.05) as shown in Figure 4. The concentrations of the samples were determined by interpolating them from the standard curve. We were able to discover important results, such as a significant rise in the analyte concentration in the treated groups as compared to the control groups (p < 0.01). This assay provides evidence of the efficacy in changing the levels of the analyte.
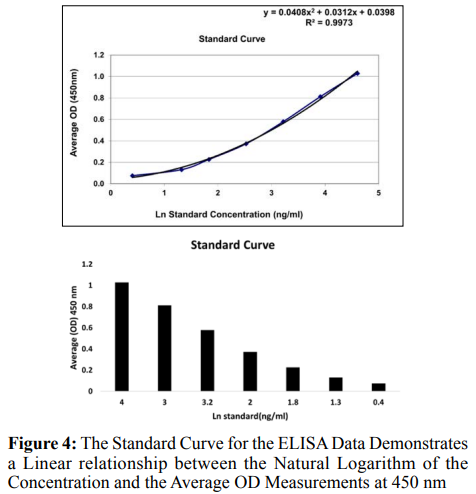
The Standard Curve for the ELISA Data Demonstrates a Linear relationship between the Natural Logarithm of the Concentration and the Average OD measurements at 450 nm, with an R2 value of 0.99, Indicating an excellent fit for the data. This curve is fundamental for converting OD Measurements into Concentrations for the Samples Analyzed.
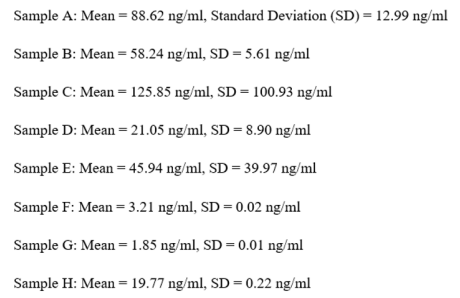
The analysis showed significant diversity among the samples, both in terms of their average concentrations and the level of variability (as shown by the standard deviation). Sample C exhibits a significantly high standard deviation, indicating a notable difference in outcomes among the wells. The difference may be attributed to either experimental error or biological variability.
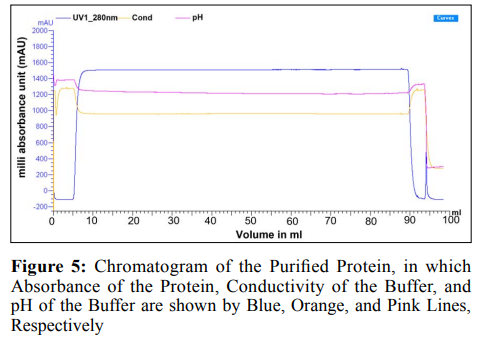
Purification is the process of removing decoy from the protein sample that is suggested sample is contamination-free. In Figure 5, the chromatogram of the purified protein shows that the blue line represents the absorbance of the protein at 280nm. Here, a sharp rise and fall indicated the elution of the protein. Moreover, the conductivity and pH of the buffer showed stability during the run. In the steps that follow, SDS-PAGE and western blotting are used to examine the expressed protein.
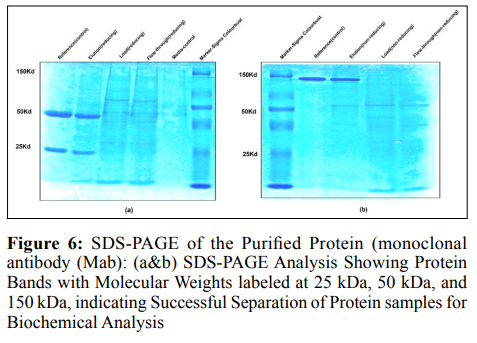
Characterization of Purified Protein by SDS-PAGE Analyzed the expression of the isolated protein using SDS-PAGE. Figure 6 shows that in well 1, Reference was combined with a reducing dye. Reducing dye disrupts the di-sulfide bond, leading the antibody’s light and heavy chains to split. Well 2 had an elution sample of Mab clone 1 with reducing dye, well 3 had Mab clone 1(load) loaded with reducing dye, and well 4 had the flow-through of Mab clone 1 added. Media control was carried out in well 5, ladder in well 6 (molecular weight references 220Kd-8Kd), Reference standard (non- reducing dye) in well b2, Mab clone 1 elution (non- reducing dye) in well b3, load in well b4, and flow through (without reduction) in well b5. Consequently, a band of 150 kD was seen in the non-reducing reference and Mab clone samples, whereas the reducing elution sample of the Mab clone in well 2 demonstrated antibodies at 50 kD (heavy chain) and 25 kD (light chain), which are in agreement with the standard. Overall, the similarity in molecular weight between the cloned antibody’s chains and the Reference standard under reducing and non-reducing circumstances indicates that the monoclonal antibody has been successfully expressed with the anticipated subunit composition.
Analyzed the expression of the isolated protein using SDS-PAGE. Figure 6 shows that in well 1, Reference was combined with a reducing dye. Reducing dye disrupts the di-sulfide bond, leading the antibody’s light and heavy chains to split. Well 2 had an elution sample of Mab clone 1 with reducing dye, well 3 had Mab clone 1(load) loaded with reducing dye, and well 4 had the flow-through of Mab clone 1 added. Media control was carried out in well 5, ladder in well 6 (molecular weight references 220Kd-8Kd), Reference standard (non- reducing dye) in well b2, Mab clone 1 elution (non- reducing dye) in well b3, load in well b4, and flow through (without reduction) in well b5. Consequently, a band of 150 kD was seen in the non-reducing reference and Mab clone samples, whereas the reducing elution sample of the Mab clone in well 2 demonstrated antibodies at 50 kD (heavy chain) and 25 kD (light chain), which are in agreement with the standard. Overall, the similarity in molecular weight between the cloned antibody’s chains and the Reference standard under reducing and non-reducing circumstances indicates that the monoclonal antibody has been successfully expressed with the anticipated subunit composition.
Characterization of Purified Protein by Western Blotting The purified monoclonal antibody clone 1 expression was also examined using western blotting. The sample preparation and loading for analysis in Figure 7 were executed in a manner consistent with the SDS-PAGE protocol, ensuring the equivalence of reagent and sample volumes across the assay. In the Figure 7, the monoclonal antibody (Mab) clone 1 elution sample lane 2 displayed multiple bands, with prominent bands observed at approximately 25 kDa & 50 kDa for reducing samples, corresponding to the expected molecular weight of the Light and heavy chain, aligning with the Reference standard at Lane1 and established molecular weight standards at Lane 6 220Kd-8Kd). Additionally, both the Mab clone 1 load (Lane3) and Mab clone 1 flow-through (Lane 4) samples exhibited inconsistency in bands, indicative of the presence of the incomplete light and heavy chain component, whereas non reducing (Figure.7b) reference and Mab clone sample shows multiple bands along with a distinct band of 150 kD, indicative of the presence of different combination of light and heavy chain or may be possible truncated chains.
The purified monoclonal antibody clone 1 expression was also examined using western blotting. The sample preparation and loading for analysis in Figure 7 were executed in a manner consistent with the SDS-PAGE protocol, ensuring the equivalence of reagent and sample volumes across the assay. In the Figure 7, the monoclonal antibody (Mab) clone 1 elution sample lane 2 displayed multiple bands, with prominent bands observed at approximately 25 kDa & 50 kDa for reducing samples, corresponding to the expected molecular weight of the Light and heavy chain, aligning with the Reference standard at Lane1 and established molecular weight standards at Lane 6 220Kd-8Kd). Additionally, both the Mab clone 1 load (Lane3) and Mab clone 1 flow-through (Lane 4) samples exhibited inconsistency in bands, indicative of the presence of the incomplete light and heavy chain component, whereas non reducing (Figure.7b) reference and Mab clone sample shows multiple bands along with a distinct band of 150 kD, indicative of the presence of different combination of light and heavy chain or may be possible truncated chains.
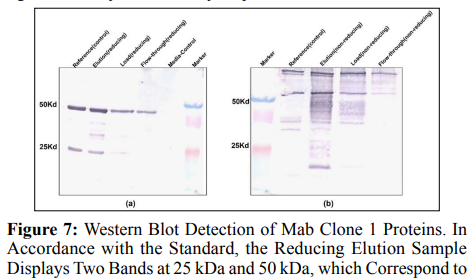
the Antibody’s Heavy and Light Chains, respectively. In contrast, the non-reducing Sample Displays a mixture of Bands with a Single Band at 150 kDa.
This work used stringent procedures to create and purify a recombinant monoclonal antibody (mAb) that targets CD20. CD20 is a therapeutic target since it is located on the surface of some cancer cells. Rituximab is a chimeric monoclonal antibody that targets CD20 precisely; we generated our recombinant antibody by using its heavy and light chain genes. The sequences of Rituximab were meticulously aligned using BLAST, a process mirrored in numerous studies. To guarantee the originality of the genetic material used in vector creation, other research endeavours have also employed sequences taken from known sources. It is worth noting that Hershberg et al. used ClustalX to analyse FASTA sequences for all clonal variants in Sjogren’s syndrome [26]. Our study also utilized the HEK-293 cell line, a standard choice in the industry for expressing monoclonal antibodies in mammalian cells. The cultivation conditions we adopted are conventional yet optimized to ensure the best possible cell proliferation and protein synthesis. In this context, the study by Razaghi et al. used the HEK 293 cell line to explore the expression of hiFNy, a protein with higher therapeutic efficacy against drug-resistant ovarian cancer (SKOV3) [27].
Our expression vector includes an AmpR promoter, which has been extensively tested for its efficiency in various studies. For example, in a culture of serum-free HEK293 cells, Swiech et al. documented the ability to produce recombinant factor VIII at concentrations as high as 200 µg/L. In a similar vein, Li et al. [28] showed that bicistronic systems driven by CMV promoters might outperform conventional monocistronic systems in producing monoclonal antibodies with expression levels as high as 4 mg/L. The HEK293-F suspension cell line is known for its rapid growth, and Vink et al. were able to achieve titers of up to 400 mg/L in as little as four to six days of culture using an efficient episomal transient expression platform. In addition, Jäger et al. used a PEI-based transfection approach to obtain recombinant scFv-Fc antibody titers of 10-20 mg/L in adherent CHO cells [29].
Transient expression of recombinant proteins has made considerable use of HEK293 cells and its variants. Similarly, the study by Abaandou et al. showed HEK293 cell line is a valuable producer of biotherapeutics due to its human origin and amenability to genetic modifications. Genetic modifications targeting cellular processes and bioprocess optimization have significantly enhanced the growth and production performance of HEK293 cells [30]. The study by Lavado-García et al. focuses on the molecular changes in HEK293 cells at high densities, during transfection, and Virus-Like Particle (VLP) production, aiming to optimize VLP production for vaccines. Multiplexed quantitative proteomic analysis reveals functional and metabolic profiles, identifying physiological bottlenecks in VLP production, alterations in cell biology at high cell densities, and disruptions in cellular homeostasis post-transfection [31].
The results show that HEK-293 cell productivity may be greatly affected by factors such as the kind of recombinant protein, the structure of the expression vector, and the choice between adherent and suspension cell cultures. This comprehensive analysis underscores the importance of selecting optimal expression conditions to maximize protein yield, which is essential for advancing therapeutic applications.
This study successfully designed and produced a recombinant anti-CD20 monoclonal antibody using a mammalian HEK-293 cell expression system. The expressed antibody was characterized and confirmed to have the expected biochemical properties. The developed expression platform provides a valuable tool for rapidly manufacturing research quantities of this therapeutic antibody for further studies. While the expression yields could potentially be improved through optimization of culture conditions and host cell engineering strategies, the current system represents a robust starting point. Looking ahead, evaluating the purified antibody’s binding affinity, specificity and effector functions against CD20- expressing cell lines or clinical samples will be critical next steps to fully validate its therapeutic potential and the same will be targeted in next article. Additional recombinant monoclonal antibodies of interest may also be produced using this adaptable modular expression technological advances.