Author(s): Adejo OH, Ojo SA, Uzuh FU, Abere DV*, Ayeni TS, Adamu UW, Abubakar UBS, Yahaya IO
Reinforcement steel bars are often exposed to the atmosphere before use in concrete structures. This exposure results in corrosion of these reinforcement bars. Corrosion of reinforcement bars is a common form of degradation of reinforced concrete structures. The electrochemical attack affects the mechanical properties of steel rebars. This study analysed the effect of exposing reinforcing steel bars to the atmosphere. The bars were divided into two; one part was exposed to the atmosphere for a period of four months during the rainy season while the other was unexposed. Afterwards; some mechanical, corrosion and metallographic tests were carried out on the steel samples. The results obtained showed that the hardness, impact strength and ductility increased with exposure while the yield and tensile strengths decreased with exposure. The exposed bar had high corrosion rates than the unexposed bar in 1M hydrochloric acid (HCl) while in 1M sodium chloride (NaCl), the corrosion rates for both the exposed and unexposed bars did not follow a particular trend.
Reinforcement steel is a common steel bar, and is commonly used as a tensioning device in reinforced concrete and reinforced masonry structures holding the concrete in compression; it is usually formed from carbon steel and is given ridges for better mechanical anchoring to the concrete. The problem of durability of the reinforced concrete has arisen, dramatically, in the last decades. The analysis of the actual damages in reinforced concrete constructions has shown that one of the most dangerous degradation phenomenon is connected to the corrosion of the reinforcing steel bars [1]. One approach that can be followed to obtain durable reinforced concrete structures is to improve the durability of reinforcing steel. Exposure to rainfall affects reinforcement steels gradually and detrimentally. The combination of ultra violet light, oxygen and water causes reinforcing steels to degrade. Steel, a major source of structural strength corrodes easily because of microstructural imbalance [2].
Corrosion is a natural phenomenon man has to live with, it cannot be totally eliminated. The best that could be done is to adapt methods to minimize its effects. Reinforcement steel bars are usually exposed to one form of corrosive environment or the other. The manner these environments react with the reinforcement steels determines how long and how well the structures will perform in service. ASTM terminology (G15) defines corrosion as the chemical or electrochemical reaction between a material, usually a metal, and its environment that produces a deterioration of the material and its properties [3]. Corrosion damages the superficial layer of steel rebar’s, causing a worsening of their mechanical properties in terms of strength and ductility. Corrosion enhances damage and creates pits and notches, resulting in stress concentration points and progressive reduction of strength [1].
Repairing damage caused by corrosion is a multibillion dollar problem. Observations of numerous structures show that corrosion of reinforcing steels is either a prime factor or at least an important factor, contributing to staining, cracking and/or spalling of concrete structures [4]. A tour of construction sites show that reinforcing steel bars are left exposed to the elements for long periods of time [5]. The extent and effect of degradation due to such exposure has not been adequately investigated. The aim of this study therefore, is to investigate the effect of this exposure to the mechanical and corrosion properties of the reinforcing steel bars.
The steel material used is a 10mm diameter reinforcing steel bar which was sourced locally. The chemical analysis of the material was carried out at National Metallurgical Development Centre, Jos using an Optical Emission Spectrometer. Other materials used include hydrochloric acid (HCl), sodium hydroxide (NaOH), sodium chloride (NaCl), water Nital (etchant), diamond polish, alumina. The equipment used in the course of this research include digital weighing balance, Indentec Universal Hardness Testing Machine model 8187.5 LKV, W & T Avery Izod impact machine, 120FT.Lb.capacities type 6701 Birmigham England, 500KN Capacity Denison Tensometer, model T4282, Leeds England Grinding Machine (Manually/Electrically controlled), Polishing Machine, Metallurgical Microscope with In-built Camera, retort stand, beakers, hack saw, tongs, grit papers (sizes 120, 180, 320, 400, 600) and flat file.
The steel sample was cut into two (2), one was exposed to the atmosphere during the rainy season for four months while the other was kept in a dry place. The samples were then cut into the required dimension of 10mmx10mm for the corrosion test with the use of hack saw. The samples were placed on a vice before cutting. During cutting, coolant (water) was used to cool off the sample from heat generated as this can affect its properties/ microstructure. About 18 samples were cut from each rod.
1. Tensile samples - about 200mm was cut from the sample for tensile tests. An average of 2 samples was cut from both rod samples.
2. Impact samples - about 200mm was cut from the sample for impact testing.
A total of 42 samples were prepared for the various tests conducted.
The prepared samples were first weighed using the analytical weighing balance and the readings recorded as the initial weight of the coupons. The beakers were washed and cleaned using a smooth cloth. Concentrations of 1M HCl, 1M NaCl and 1M NaOH were prepared and poured into three (3) beakers each. Six (6) samples of the exposed steel bar were suspended in the solution of 1M HCl, six other samples of the exposed bar were suspended in the solution of 1M NaCl and the remaining six (6) were suspended in the solution of 1M NaOH by means of threads. The above procedure was repeated for the unexposed steel bars using the remaining solutions of 1M HCl, 1M NaCl and 1M NaOH. A sample of each rod (i.e. the exposed and unexposed) was removed from each of the solutions (i.e. 1M HCl, 1M NaOH and 1M NaCl) after every five (5) days and weighed. The weight was then recorded as the final weight of the coupons. The corrosion test was carried out for a total of thirty (30) days.
The tensile test was carried out using a 500KN capacity DensionTensometer. The actual load used for the test was set at 200KN. The specimens for testing were marked with a gauge length of 50mm with the help of marking sectional area was measured for each sample before testing. Each of the samples attached the dial gauge (extensometer), which measures the strain as the tensile load is applied while the other side of the Tensometer measures the force applied to the samples. In the process of testing, continuous load was applied to the sample at an interval of 5KN until it fractured. The yield load, maximum load and the breaking load with their corresponding extensions were read.
The impact test was performed using the W & T Avery Impact Testing machine. The samples for impact test were noticed at the centre with the use of a v-shaped file. The diameters of the samples were measured using a Vernier calliper. This was followed by filling to get the v-notch shape on the sample. The dimensions of the test specimen were 80mm length, 10mm diameter and 2mm depth of the notch at the middle. The notched samples were placed inside a vice in the Izod machine, the v-notch side facing the pendulum. The pendulum was raised to a standard height, with reference to the viseholding the sample. The chuck holding the pendulum was released as the potential energy was converted to kinetic energy, until it struck the sample. The energy possessed by the pendulum rose on the other side of the machine to a height lower than its initial height on the opposite side of the impact testing machine. The energy consumed in breaking the specimen was read from the dial of the impact testing machine. The energy was measured in foo-pounds and it is known as the notched impact strength. (Note: 1 foot-pound = 1.35581795 Joules)
The samples were sectioned to suitable sizes that could be handled. The samples were then filed to obtain flat surfaces on both sides of the samples in order to enhance accurate viewing under the microscope, easy and faster results during grinding, and also for accuracy the hardness test. Water was used as coolant.
Both rough and fine grinding were carried out on the specimen. The rough grinding was done using the electrically operated grinding machine and grit paper (silicon carbide) of grit size 120. Fine grinding was done using the manually operated grinding machine and silicon carbide papers of grit sizes 180, 320, 400 and 600 till smooth, scratch-less or mirror-like surface was obtained. Water was added as coolant during grinding.
It was done by mechanical polishing, which is a gradual removal of materials from the sample surfaces. The samples went through two stages of polishing; fine and rough polishing. Rough polishing was done with cloth impregnated with 6 to 9µ particle diamond paste and then followed by 3µ particle size alumina on a spot polishing cloth. Polishing was done to obtain a mirror-like surface.
This is the chemical attack of the exposed sample surface. The etchant used was 2% nital. Etching of the steel samples was dome b swabbing, using cotton wool until the surface was properly etched.
The etched samples were viewed under the metallurgical microscope to see the different phases present. Photomicrographs were obtained by taking digital photograph of the microstructure revealed by the etching. Soft copies of the images were saved for easy printing.
The samples used for the micrograph were further ground using the 600 grit paper to remove the etched surface from the samples. The ground samples were each placed on the anvil and were raised up against an indenter until a minor load was reached. The major load was applied on the indenter by a lever, enough time passing for the indenter to press into the test sample and stop.
The results obtained from this work are presented below
Table 1: Chemical Analysis of Reinforcing Steel sample
| Element | C | Si | Mn | P | S | Cr | Ni | Mo | Al | Cu | Ti | Fe |
|---|---|---|---|---|---|---|---|---|---|---|---|---|
| Content % | 0.27 | 0.15 | 0.80 | 0.040 | 0.050 | 0.07 | 0.30 | 0.30 | 0.00 | 0.30 | 0.00 | 97.99 |
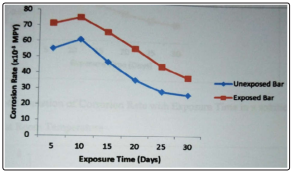
Figure 1: Variation of Corrosion Rate with Exposure Time in a solution of 1M HCl at Room Temperature
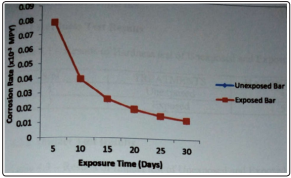
Figure 2: Variation of Corrosion Rate with Exposure Time in a solution of 1M NaOH at Room Temperature
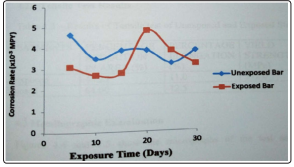
Figure 3: Variation of Corrosion Rate with Exposure Time in a solution of 1M NaCl at Room Temperature
Hardness Test Results
Table 2: Results of Hardness test of Unexposed and Exposed Steel Bars
| S/N | TREATMMENTS | HARDNESS (HRA) |
|---|---|---|
| 1 | Unexposed | 55.2 |
| 2 | Exposed | 57.1 |
Impact Test Results
Table 3: Results of Impact test of Unexposed and Exposed Steel Bars
| S/N | TREATMMENTS | IMPACT (JOULES) |
|---|---|---|
| 1 | Unexposed | 63.7 |
| 2 | Exposed | 67.8 |
Table 4: Results of Tensile test of Unexposed and Exposed Steel Bars
| S/N | TREATMMENTS | PERCENTAGE REDUCTION IN AREA (%) | PERCENTAGE ELONGATION (%) | YIELD STRENGTH (MPa) | TENSILE STRENGTH (MPa) |
|---|---|---|---|---|---|
| 1 | 45.25 | 11.0 | 372.0 | 687.5 | |
| 2 | Exposed | 64.00 | 12.5 | 361.6 | 578.0 |
Figures 4 and 5 show the micrographs of the test samples under investigation
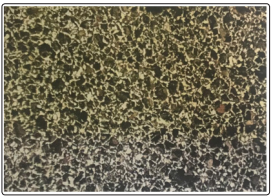
Figure 4: Micrograph of As-Received Reinforcement Bar. The Microstructure Consists of Uniform Distribution of pearlite (dark patches) and Ferrite (white patches). (x200)
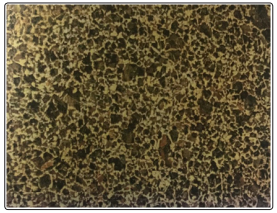
Figure 5: Micrograph of Exposed Reinforcement Bar. The Microstructure Consists of Uniform Distribution of pearlite (dark patches) and Ferrite (white patches). (x200)
Corrosion rate of the steel sample in HCl increases with increase in exposure time. HCl is very corrosive to most metals and alloys especially when aeration or oxidizing agents are present. From figure 1, it could be observed that the corrosion rate of the exposed bar was higher than that of the unexposed bar in a solution of 1M HCl. For both bars, the corrosion rate initially increased for the first ten days of exposure and gradually decreased with increasing exposure time. The initial increase in corrosion rate could be as a result of the formation of corrosion-accelerating scale or the removal of the resistant surface layer of metal [6,7]. The gradual decrease in corrosion rate could be as a result of depletion of a corrosive environment or removal of less resistant surface layer of the metal. Also, deposition of an impervious metal oxide film, which is a solid interfacial compound that protects the metal against further.
Oxidation could be another reason [1]. The higher corrosion rate of the exposed bar could be as a result of a decrease in its corrosion resistance by the atmosphere corrosion it had been subjected to [8]. NaOH is not particularly corrosive and can be handled in steel in most applications where contamination is not a problem [6]. From figure 2, the corrosion rate for both steel bars was the same in a solution of 1M NaOH. This is because NaOH is particularly corrosive to steels [4]. The corrosion rates for both bars decreased with increasing exposure time. Chloride solution is highly corrosive. It is a good electrolyte and can cause galvanic corrosion and crevice corrosion. Corrosion in seawater is affected by oxygen content [6]. Seawater also causes pitting corrosion in stagnant condition. Corrosion rates of metals in seawater increases with increasing exposure time [5]. From figure 3, the corrosion rate of the exposed bar in 1M NaCl decreased during the first ten days of exposure, it became steady for the next five days of exposure, suddenly increased during the next five days and gradually decreased during the remaining period of exposure the initial decrease in corrosion rate could be as a result of the deposition of an impervious metal oxide film, which is a solid interfacial oxide compound that protects the metal against further oxidation [9]. The rapid increase in corrosion rate with increasing exposure time could have been as a result of breakdown of the oxide film leaving localized bare metal experiencing corrosion at relatively high potential due to instability of the passivation or the presence of environment impurities that retard the formation of the passive film or accelerates its degradation. The final decrease healing nature of the film that, when broken, will repair itself on re-exposure to oxidizing condition [10]. The corrosion rate of the unexposed steel bar decreased initially, increased after the first ten days of exposure, became steady for some time, decreased again and finally increased. The initial decrease could have been as a result of the deposition of an impervious metal oxide film, the increase in corrosion rate could have been as a result of the breakdown of the oxide film, the decrease in corrosion rate with time again could have been as a result of the re-deposition of the oxide film and the final increase in corrosion rate with exposure time would have been as a result of the breakdown of the oxide film [3].
Upon inspection of the micrographs for the exposed and unexposed steel bars, no variation in the microstructure was observed. The microstructures both showed a uniform distribution of pearlite (dark patches) and ferrite (white patches). The lack of variation in the microstructures of the steel rods could be as a result of the exposed period not being long enough to have much effect on the microstructure of the exposed steel bar. Using the lever rule, the amount of ferrite that is expected to be present is 67.9% and the amount of pearlite is 32.1%. From these results, it is expected that the microstructure of the steel should have a uniform distribution of ferrite and pearlite in nearly equal amounts. Therefore, from the micrographs, it can be seen that the microstructures do not deviate from the expected outcome [2].
From Table 1, 2 the unexposed bar hardness value is 55.2HRA while the exposed bar hardness value is 57.1 HRA. This implies that the exposed bar is slightly more resistant to penetration than the exposed bar. This could have been as a result of some chemical reactions that occurred during the exposure and formation of rusts that increased the surface strength of the exposed steel bar [11].
From Table 3, the unexposed steel bar had an impact value of 63.7 Joules while the exposed bar had an impact value of 67.8 Joules. This implies that the exposed bar has a toughness higher than that of the unexposed bar. This is as a result of the exposed bar having lower yield strength and fatigue strength. Toughness usually increases with reduction in yielding and fatigue strengths [12].
From Table 4, it can be seen that the unexposed steel bar had a percentage reduction in area of 45.25% and a percentage elongation of 11.0% while the exposed bar had a percentage reduction in area of 64.0% and a percentage elongation of 12.5%. From these results, it can be seen that the exposed bars are more ductile than the unexposed bars. This could have been as a result of the formation of rust due to the exposure in the exposed bars. From Table 4 also, the unexposed steel bars had yield strength of 327 MPa and a tensile strength of 687.5 MPa while the exposed bar had a yield strength of 361.6 MPa and a tensile strength of 578 MPa. From these results, it can be observed that the exposed bars had lower yield and tensile strengths compared with the unexposed bars. This implies that the exposed bars required less loads to cause deformation than the unexposed bars. This is because of the atmospheric corrosion they had been subjected to which caused a deterioration of their yield and tensile strengths. Corrosion damages reinforcement bars causing a worsening of their tensile and yield strengths and the tensile property of steel is its most attractive property for use in concrete structure [12].
Based on the research carried out on the effect of exposure to rainfall on the mechanical and corrosion properties of 10mm diameter reinforcing steel rods, the following conclusions were drawn:
I The hardness value of the exposed bar was higher than that of the unexposed bar.
II The impact value of the exposed bar was higher than that of the unexposed.
III The exposed bar had higher values of percentage reduction in area and percentage elongation. The elongation values of the unexposed steel rod conformed to the standard specified for Grade 420 steels by the Standard Organisation of Nigeria.
IV The exposed bars had poorer yield and tensile strengths than the unexposed bars. The yield strength of the unexposed bar does not conform to the standard set by the Standard Organisation of Nigeria.
V No variation was seen in the microstructures of both the exposed and unexposed steel rods. The microstructures obtained conformed to the microstructures expected using the lever rule.
VI The corrosion rate of the exposed bar was relatively higher than that of the unexposed bar in a solution of 1M HCl. The corrosion increased and then decreased with exposure time. In a solution of 1M NaOH, the corrosion rates for both bars were the same. In the solution of 1M NaCl, the corrosion rates for both the exposed and unexposed bars did not follow a particular trend.
Therefore, based on the outcome of this study, it can be inferred that exposure of reinforcing bars to the atmosphere during rainy season leads to the deterioration of tensile and corrosion resistant properties of these steel bars to some extent and as a result may lead to failure of steel reinforced concrete structures. Therefore, reinforcement bars should not be exposed to the atmosphere during the rainy season before use as reinforcement for concrete structures.