Author(s): Okeke Sunday Okechukwu, Onwuegbuche Anthony Azunna, Chinwuko Augustine Ifeanyi* and Okonkwo Churchill Chukwunonso
Four Aeromagnetic data over a part of the Nigerian Sector of the Mamfa Basin have been analyzed using qualitative approach and spectral analysis. The aeromagnetic maps, its analytic signal amplitude and geological modelling sketch helped in identifying the nature and depth of the magnetic sources in the study region. The qualitative interpretation reveals that the study area is characterized by magnetic lineament trend in NE-SW direction and subordinate E-W direction. The results obtained are in line with the trend of the Benue Trough. The aeromagnetic maps reveal that the sedimentary thickness increases towards the northern parts of the study area. The results also reveal that the total magnetic field intensity range from 7800 to 8290 nanotesla (nT) in the study area. The residual anomaly map reveals that the maximum anomaly value is 160nT which is found around Bansara and Ugep environs while the minimum magnetic value is -140nT towards the Abakiliki and Ikom areas. Results from spectral analysis indicated two magnetic source depths, which account for deeper and shallower sources. The deeper magnetic sources vary from 2.76 km near Abakiliki to 5.37 km near Bansara, whereas the shallow magnetic sources vary from 0.58 km near Ikom to 1.76 km near Ugep. The depth to basement map reveals that the sediment thickness increases towards the northern parts of the study area. The depths to basement are deeper in the northern and central parts trending northwest-southeast direction and shallower in the eastern and southern parts of the study area. The result also shows a linear depression with sedimentary accumulation trending northwest-southeast. The temperatures at depth for each anomaly block were estimated to range between 48.46 and 225.69°C with an average of 117.04°C. Based on the computed sedimentary thickness (2.76-5.37km) and temperature at depth (62-220°C), the possibility of hydrocarbon generation in the northern and central parts of the study area is realistic
Aeromagnetic data are magnetic data obtained during any magnetic survey carried out in the air, such that the magnetometer is attached on the jet/plane in order to obtain the Earth’s magnetic anomalies of the underlying rocks [1, 2, 3, 4]. The speed of operation and cost make airborne magnetic surveys very attractive, where the main objective has been to assist in mineral and ground water development through improved geologic mapping. In addition, aeromagnetic surveys have been applied at the early stage of petroleum exploration to determine depth and major structure of crystalline basement rocks underlying sedimentary basins [4].
More so, one major challenge in the discovery of hydrocarbon in some parts of the Nigerian sector of the Mamfe Basin has been the presence of intrusive igneous bodies in most of the wells drilled [5]. There is therefore great need to re-evaluate the geology of the basin since the same basin outside Nigeria is productive. Hence magnetic survey is the first geophysical tool to start with. Also, aeromagnetic survey is one of the most important tools used in modern geological mapping. It is a rapid and cost effective technique for locating both hidden ores and structures associated with mineral deposits.
Subsequently, spectral analysis was the mathematical tool chosen for the interpretation due to its potent along with its advantageous way of filtering noises from the data without lost of information compared to graphical method. The spectral analysis is usually performed on the frequency domain where magnetic anomalies easily and clearly identified compare with the space domain. However, this research focuses on the analysis of magnetic data using spectral analysis over the southeastern part of the Mamfa Basin Nigeria in order to obtain the configuration of the basin itself by determining the depth to magnetic basement, temperature at depth and structural attributes of the study area.
The study area falls within the Mamfe Basin, which is a sedimentary basin that border Cross River State in Nigeria and South Western Cameroon. The geographical coordinates of the study area lie between 8° 001 and 90 001 E of longitude and between 5° 301 and 60 30l N of latitude, covering an area of approximately 12,100 km2 . The major towns are Abakaliki, Bansara, Ugep and Ikom (Fig. 1). The study area is characterized by a variety of lithological units, which include many types of igneous, metamorphic and sedimentary rocks (Fig. 1). According to the progressive sea level rise from Albian-Maastrichtian period led to worldwide transgression, regression and local tectonics which yield Cretaceous sedimentation within the study area [5 & 6].

Figure 1: Geologic Map of the study area (Modified after Obi et al., 2013)
Four aeromagnetic data (Fig. 2) were acquired namely; Sheet 303 (Abakiliki), Sheet 304 (Bansara), Sheet 314 (Ugep) and Sheet 315 (Ikom). The aeromagnetic data were obtained as part of the nationwide aeromagnetic survey sponsored by Geological Survey Agency of Nigeria (GSAN). These sheets were combined and ontoured to produced a total magnetic intensity map (TMI) as shown in Fig. 3.The trend surface equation (equation 2) obtained across the randomly selected data were subtracted from the aeromagnetic data to give the residual anomaly data which were contoured to produce a residual anomaly map (Fig. 4). linear regression method was used in the methodology in order to separate the residual data from regional data using the trend surface equation (regional gradient) below [7];
P(x,y)=7.9958x+5.7207y+7490.03 (1)

Figure 2: Aeromagnetic Sheets of the Study
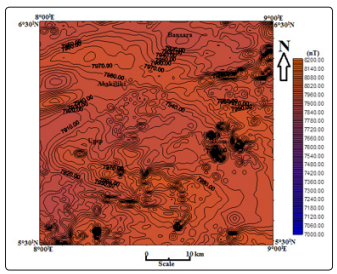
Figure 3: Total Magnetic Intensity map of the study area (Contour Interval ≈ 10nT)
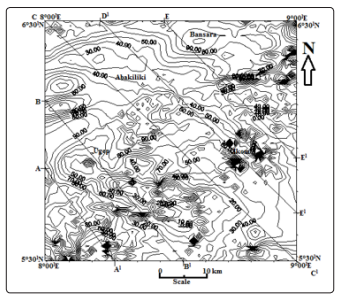
Figure 4: Residual Anomaly map of the study area with profile lines (Contour Interval ~ 10 nT)
The next step was the qualitative interpretation which involves visual inception analysis which was carried out on both the TMI and residual maps based on magnetic closures and lineament delineation through the azimuth direction of the structural lineaments according to [3 & 8]. Following this step was the spectral analysis of the residual data in order to obtain the sedimentary thickness (depth to magnetic sources) and the temperature at the basement across the study area. The spectral analysis is a mathematical tool which utilizes Discrete Fourier Transform technique to estimate geophysical attributes as shown by several authors such as Spector and Grant and others [1-4 & 8-20]. The method was chosen because of its advantage of filtering all the noise away from the data. Secondly, during the application of this method, information is not lost in the process unlike other methods.
More so, the temperature at depth within the study area was estimated according to Onwuemesi, using equation 2 below [1]:
Where, Th = temperature in °C at depth (h); m = geothermal gradient; h = depth of interest; To = surface temperature.
Furthermore, it was assumed that the surface temperature was 27°C while the average geothermal gradient in the study area was given by Onuba et al. [21] as 37°C/km.
The qualitative interpretation is done by visual inspection of the total magnetic intensity (TMI), residual anomaly, and lineament maps.
The total magnetic field map produced depicts that magnetic properties within the area is between 7800 to 8290 nT (Fig. 3). The map also reveals that there are clustered contours around the southern and eastern zones of the area, which implies that structural features such as faults are present within the area (Fig. 3). According to Chinwuko et al., along the fracture zone there would always be a magnetic susceptibility contrast because of oxidation of magnetite to hematite within the country rock [12]. The availability of closures in the study area suggest the presence of magnetic sources (Fig. 3).
In addition, the residual anomaly map (Fig. 4) produced after subtracting the regional magnetic field data from total magnetic field intensity data yielded data for estimation of sedimentary thickness or depth to basement. The maximum magnetic value within the residual map is 160nT which is found around Bansara and Ugep environs while the minimum magnetic value is -140nT towards the Abakiliki and Ikom areas (Fig. 4).
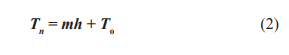
A magnetic lineament within the study area was produced as shown in Fig. 5. The map depicts that the major trend of the structural lineaments within the area is predominantly in northeastsouthwest (NE - SW) direction, whereas, the minor trend tends towards East-West (E-W) direction (Fig. 5). The importance of tectonics within the area is suggested by the lineament trends present which conform to the trend of the Benue Trough in Nigeria. This trend may sever as pathway for mineralization within the study area and the area can be associated with rift origin due to the closeness of the Benue Trough origin
Figure 5: Magnetic lineament within the study area
The essence of quantitative interpretation is to obtain information about the depth to magnetic sources, its shape and size, and probably details about its susceptibility. Hence, quantitative interpretation is presented in the subsection below.
Five selected magnetic profiles, namely A-A1 , B-B1 , C-C1 , D-D1 and E-E1 , were used for detailed interpretation (Figs. 4 and 6) and these serve as representatives of others since they behave almost the same way. The graphs of the natural logarithms of the amplitude against frequencies obtained for the various profiles were plotted. Linear segments from the low frequency portion of the spectral, representing contributions from the deep - seated causative bodies were drawn from each graph. The gradient of the linear segments were evaluated and the depth to magnetic sources were determined along the selected profiles (Fig.7 and Table 1). The gradients of the line segments are negative because in spectral analysis, the graph decreases as the frequency increases. That is, the graphs must be negative and the points outside the line segments represent noise. This is in accordance with the laws of spectral analysis [1, 2, 8, 14, 17 &18].

Figure 6: Graph of Profiles within the study area
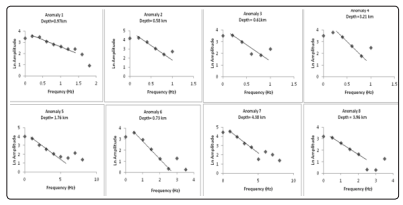
Figure 7: Amplitude spectral for all analyzed anomalies within the study area
Table 1 shows a summary of basement depths obtained from spectral analysis carried out in the study area. Basement depths along profile A-A1 ranges from 0.58 to 0.97km, along B-B1 the depths range from 0.73 to 4.38km, 2.76 to 4.38km along C-C1 , along profiles D-D1 and E-E1 the depths range from 0.72 to 5.37km and 0.62 to 5.08km respectively. The average sedimentary thickness in the region is about 2.43km, which is in agreement with the results of Obi et al., that established the sedimentary thickness in the Mamfa Basin to be 0.5 to 4.3km [5].
Furthermore, the depth results obtained confirms with the sediment load determined through other geophysical methods such as gravity method and the sediment load determined ranges from 3 - 4 km by some earlier workers [22]. This sediment load thought to be Aptain to Albian age, which is made up of conglomerates, sandstones, mudstones, claystones, carbonaceous and non-carbonaceous shales gravity method and the sediment load determined ranges from 3 - 4 km by some earlier workers [22]. This sediment load thought to be Aptain to Albian age, which is made up of conglomerates, sandstones, mudstones, claystones, carbonaceous and non-carbonaceous shales as well as several limestone occurrences [22].
Using the depth values determined from the spectral analysis method, two depth models were established. The deeper magnetic sources vary from 2.76 to 5.37km, whereas the shallow magnetic sources vary from 0.58 to 1.76km (Fig. 8). Deeper magnetic sources may probably represent depths to Pre-Cambrian basement, while the shallower magnetic sources may represent depths to basic intrusive and/or magnetized bodies within the sedimentary cover. The depth to the basement is shallower in the eastern and southern parts of the study area, whereas towards the northern and central parts it is shallower (Fig. 8). The 3-D surface plot (Fig. 9) were also produced and it shows a linear depression at the central part of the study area indicating thicker sediments which trend northwest-southeast direction while the eastern and southern parts have shallower sedimentary thicknesses (Fig. 9).
Table 1: Basement Depths and Temperature obtained from Spectral Analysis
| Profile name | Profile direction | Anomaly | Depth (km) | Temp. at Depth(?C) |
| A -AAlong Ugep | NW-SE | 1 | 0.97 | 62.89 |
| NW-SE | 2 | 0.58 | 48.46 | |
| NW-SE | 3 | 0.61 | 49.57 | |
| B-B (Along Ugep & Abakiliki)" | NW-SE | 4 | 3.21 | 145.77 |
| NW-SE | 5 | 1.76 | 92.12 | |
| NW-SE | 6 | 0.73 | 54.01 | |
| C-C (Along Abakiliki & Ikom" | NW-SE | 7 | 4.38 | 189.06 |
| NW-SE | 8 | 3.96 | 173.52 | |
| NW-SE | 9 | 3.32 | 149.84 | |
| NW-SE | 10 | 2.76 | 129.12 | |
| D-D (Along Abakiliki & Ikom)" | NW-SE | 11 | 5.37 | 225.69 |
| NW-SE | 12 | 0.72 | 53.64 | |
| E-E (Along Bansara & Ikom)" | NW-SE | 13 | 5.08 | 214.96 |
| NW-SE | 14 | 0.62 | 49.94 |
From the values of the sedimentary thicknesses obtained, which vary from 0.58 to 5.37km, the temperatures at depth for each anomaly block were estimated using equation 2 by solving for the unknown Th (temperature at depth). The values obtained range between 48.46 and 225.69°C with an average of 117.04°C (Table 1 and Fig. 10). It is good to note that the study area can favour hydrocarbon accumulation due to huge sedimentary cover towards the northern parts of the study area. In fact, according to some previous researchers on deduction of hydrocarbon formation using aeromagnetic data and any (other method and others), the thickness of sediment must be up to 2.0km as well as other conditions necessary for hydrocarbon formations [12, 14, 16, 23, & 24]. Considering the results of sedimentary thickness (0.58 - 5.37 km) obtained within the area, there is an indication that the possibility of hydrocarbon generation may be feasible.
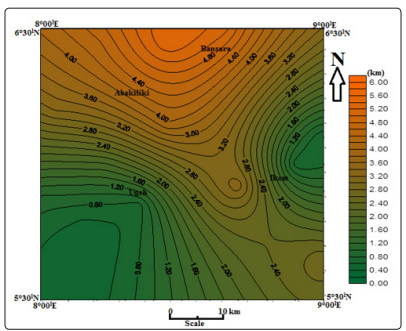
Figure 8: Depth to basement map of the study area
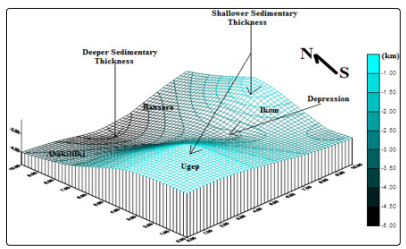
Figure 9: D Surface Plot for the basement topography of the study area
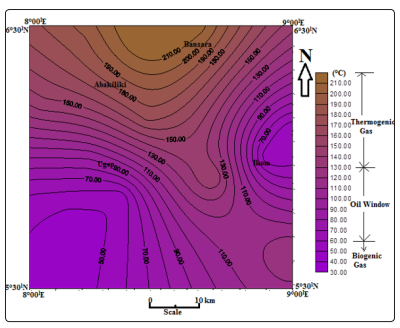
Figure 4.10: Possible area of hydrocarbon generation in the study area
The Conclusions Are As Follow