“Probabilistic Landslide Hazard Methodology, an Application to a Susceptible Area to Landslides in Colombia”
Author(s): Jairo E Yepes-Heredia
Abstract
A Probabilistic method was previously used to perform Probabilistic Hazard Zonation in El Salvador using a new proposed probabilistic methodology (Rodriguez, Yepes 2011). The current project is a case study that uses the same methodology and tries to cover the limitations of the previous and first application, and applied to two historically unstable landslides in Pipiral, an unstable area in the Central Region of Colombia. The susceptibility angle was used as the susceptibility function. Rainfall and earthquakes are considered as landslides triggers. Besides zonation, modeling was performed because the probability model was initially designed to do the zonation of larger areas. A database from “four countries in Central-America and Colombia” of Rainfall Induced Landslides in Fine-grained soils and a database of “historic and worldwide” Earthquake Induced Landslides, were considered to support the model. The intensity-duration-frequency (I-D-F) curves for the Pipiral-Colombia were used to define the probability of occurrence of the critical rainfall, and the seismic hazard analysis of the same area was used to define the probability of occurrence of the critical earthquake.
Introduction
The approach to the problem of evaluating landslide hazard via
strictly quantitative methods does not have as many references as
semi quantitative and qualitative methods. Then, when it is about
considering rainfall and earthquakes as triggers of landslides, it is
even more difficult to find valid and available references. Several
authors have developed methods that propose methodologies to
evaluate landslide hazard. Mora & Vahrson (1994) for instance,
developed a model in Costa Rica, to easily and in a practical form,
classify landslide risk in seismically active regions, presenting a
guide that allows the engineer to take fast decisions considering
five factors: slope, lithology, soil moisture, rainfall, and factors of
seismic intensity. Rodriguez, Torres & Leon (2004) determined
landslide hazard via a probabilistic method applied to destructive
seismic events up to 2004 in El Salvador using earthquakes as
triggering factor and rainfall and slope angle as susceptibility
factors. Rodriguez & Yepes (2009) also worked in El Salvador
using rainfall and earthquakes as triggering factors and slope angle
as the only susceptibility factor due to the lack of geomechanical
properties information that cover all the area. This last research
used a probabilistic model that considers the occurrence of rainfall
and earthquakes simultaneously but defining that only one of them
will trigger the landslide. This limitation is tried to be covered by
the current research. The probabilistic methodology was used to
perform landslide hazard zonation and two-dimensional modeling
using geomechanical properties close to surface was made to
consider scale differences. The probabilistic model was initially
developed to study large areas like countries. Throughout this
paper, both zonation and modeling are carried out considering
surface properties. This is because the intention is to analyze how
earthquakes and rainfall can trigger landslides. The main intention
of this paper is to contribute and to encourage civil engineers to
use probability in geotechnical engineering and to raise awareness
about the need to work with numerical methodologies for the
assessment of landslide hazard instead of using qualitative methods
that do not actually give precise results [1-5].
General Setting
To work with probability calculations and with the intention
to include variables that can affect slope stability, this work
included: seismic parameters, rainfall parameters, the slope
angle as a susceptibility value for landslide hazard zonation, and
surface friction angle for two-dimensional analysis. Topography,
seismicity, and rainfall information for the two landslides studied
in the current research project, were provided by SGC “Colombian
Geological Survey” and by IDEAM “Institute of Hydrology,
Meteorology and Environmental studies” in Colombia. Two
databases were updated:
• A worldwide historical database of earthquake-induced
landslides, prepared by Rodriguez (1767 B.C. - 2002) and Yepes
(2002 - 2007), was updated by Mosquera and Mosquera from
2009 to 2019.
• A historical database of rainfall induced landslides in four
countries of Central America (Guatemala, El Salvador, Nicaragua,
and Honduras) and Colombia prepared by Yepes (1982 - 2007)
was updated by Mosquera and Mosquera from 2009 to 2019.
A short description of the variables involved in the probability
model and the calculations, the landslide hazard zonation, and
the two-dimensional limit equilibrium analysis is included in this
chapter, as follows:
Susceptibility Parameter
In the previous research, in which this current probability model
was applied and analyzed as a first trial (Rodriguez-Yepes, 2011),
it had a notorious limitation, the lack of engineering properties that
could cover all the area of study. Parameters like the friction angle,
the intercept of cohesion, or the shear modulus, are difficult to get,
even in developed countries. These parameters would create an
ideal scenario to evaluate landslide hazard in terms of probability.
Here, two fundamental reasons did not allow the accomplishment
of this task. Firstly, the model was initially conceived for large
areas like a country. Secondly, there is going to be an evident
problem of scale when dealing with geomechanical and this
probability model (SGC, Colombian Geological Survey, 2016).
This second reason has a strong background if it is recognized
that the probability model is associated to the application and
zonation of landslide hazard in large areas, geological areas, and
its consequent geological scale. Then, geomechanical properties
“strength-deformations-permeability” are an engineering
description which is obviously associated to geotechnical areas and
its consequent geotechnical scale. A geotechnical engineering scale
is fundamentally different to a geological scale. So, the probability
methodology for landslide hazard zonation was applied to the two
landslides in Pipiral, a Central small Region of Colombia, using
the slope angle as the susceptibility parameter again. Here, the two
landslides were divided in “2.0*2.0 m2” and the probability model
was evaluated again. This second trial helped validate the model
and have a better approach to the application of the methodology.
Then, to try to cover the limitation of including geomechanical
properties in this research project, and to make it possible to refer
in more geotechnical engineering terms, two-dimensional limit
equilibrium analysis and Finite Element Analysis were modeled.
The friction angle and the modulus of elasticity were calculated
via correlations with SPT (standard penetration test) results. This
item will be explained in the following chapter, in a more thorough
form [6-10].
Seismicity parameters
Three parameters will be used to calculate the probability of
landslide occurrence due to earthquakes: susceptibility function,
the probability of occurrence of the critical earthquakes, and the
probability that this critical earthquake triggers landslides in a
specific “2.0*2.0 m2” cell. In this subchapter, the information used
to get these three parameters will be explained, and in the following
chapter, the methodology and corresponding calculations will be
explained in a more thorough way.
• Susceptibility function: the slope angle was used as the
susceptibility function. A normal distribution formulation that
better explains how slope angle influences stability of a slope,
was applied.
• Probability of occurrence of the critical earthquake: here,
the seismic hazard evaluation report for the area that covers the
two landslides was used (SGC, Colombian Geological Survey),
and the probability of occurrence of the critical earthquake was
calculated using the “Gutenberg-Richter” relationship. Seven
seismogenic sources were identified. Seven geological faults
that are close enough to the areas of study to influence them.
The scale and the size of the landslides were the main factors to
choose these seven geological faults. The area of the landslides,
as mentioned above, were divided in “2.0*2.0 m2” cells, and the
geological faults were divided in “2.0 meters” spaces. Figure 1
shows an explanatory scheme of how distances from each cell
in the two landslides to the 2-meter divisions of the geological
faults were measured:
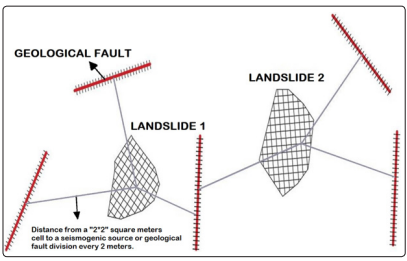
Figure 1: Explanatory Scheme of the measurement of the distance
from the landslide?s cells and the divisions in the geological faults,
to calculate the probability of occurrence of the critical earthquake
(Yepes - Mosquera, 2019)
Figure 2 presents the geological faults, the location of the two
landslides, the location of the specific region in Colombia and
the names of the faults.
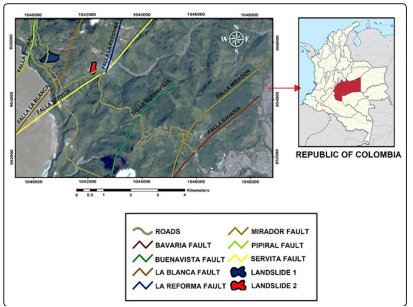
Figure 2: Geological faults from the seismic hazard study and
location of the landslides (left). Location of “El Meta” Department
in the map of Colombia (top right). Names of the faults and
landslides (bottom right). (SGC, Colombian Geological Survey)
Probability that the critical earthquake triggers landslides:
supported and calculated by a historical worldwide database of
earthquake - induced landslides (Rodriguez and Yepes, 1767B.C.
- 2007) updated by Mosquera (2007-2019).
Then, as it was initially proposed by the probability model, this
updated database was classified in the three failure mechanisms
proposed by Keefer (1984): disrupted landslides, coherent
landslides, and lateral spread and flows. The total number of
earthquake-induced landslides available in this updated database
are: 472 disrupted landslide, 141 coherent landslides, and 134
lateral spread and flows. Keefer presented a database of earthquake
induced landslides and a plot of Surface wave magnitude “Ms”
versus Maximum epicentral distance, showing a 0% and 100%
probability of slope failure due to landslides. Rodriguez and Yepes
(2011), following the idea of Keefer, proposed now curves from
0% to 100% each approximately 10%. This was plotted for thethree failure mechanisms mentioned above. Mosquera and Yepes
(2019) updated these plots, and figure 3 shows the landslide density
curves or probability of failure for the latter mechanism: lateral
spread and flows. There are two points below the 0% curve and one
point above de 100% curve. They were defined as extraordinary
and unusual behavior. They are out of the trend [16-20].
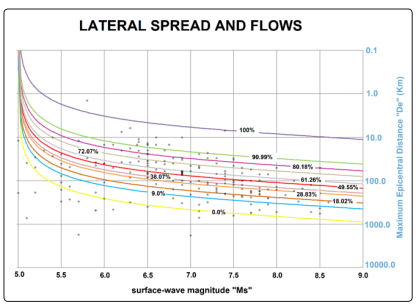
Figure 3: Landslide density curves or probability of landslide
occurrence curves for Earthquake-Induced Landslides - Lateral
Spread and Flows (Earthquake-Induced Landslides, 1767 B.C. -
2019) (Rodriguez - 2002, Yepes - 2009, Mosquera - 2019)
Rainfall parameters
The probability of landslide occurrence due to rainfall will be
thoroughly explained in the next chapter. In this subchapter,
and similar to how earthquake induced landslides are treated,
to calculate the probability of landslide occurrence triggered
by rainfall is composed by three parameters: a susceptibility
function, the probability of occurrence of the critical rainfall,
and the probability that the critical rainfall effectively generates
landslides [21-30].
• Susceptibility function: the same function used for earthquake
induced landslides was used in this case.
• Probability of occurrence of the critical rainfall: here, the
“Intensity-duration-frequency” curves (IDF) that were closer to the
critical landslides evaluated in this project, and in a proper scale,
were used. Two rainfall stations were identified: La Esmeralda
and Servita. Figure 4 shows IDF curves for the “Servita” rainfall
Station for return periods of: 2, 5, 10, 25, 50, 75, 100, and 500
years.
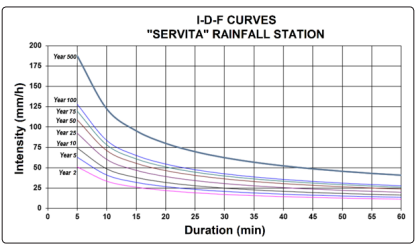
Figure 4: Intensity-Duration-Frequency curves for Servita
Rainfall Station. Return periods of 2, 5, 10, 25, 50, 75, 100, and
500 years. (IDEAM, “Institute of Hydrology, Meteorology and
Environmental studies” - Colombia)
• Probability that the critical rainfall triggers a landslide:
supported and calculated by a historical database of rainfall -
induced landslides in four countries of Central America where
fine-grained soils are frequent in all their territory: El Salvador,
Guatemala, Nicaragua, and Honduras (1982 - 2007, Yepes).
This was updated by Mosquera (2007-2019), including historical
rainfall-induced landslides in Colombia.
As it is possible to infer, the criteria for this database are different
from the database for earthquake - induced landslides. In this case,
the criteria were the type of soil, because the saturation of a slope
and the generation of pore water pressure that triggers landslides
works different in fine-grained soils, in coarse-grained soils, and in
rocks. Landslide density curves or probability of occurrence curves
were also defined for rainfall-induced landslides, in a similar form
to earthquake-induced landslides, now plotting Intensity of the
rain that caused the landslides versus the duration of this rain.
Figure 5 shows this plot.
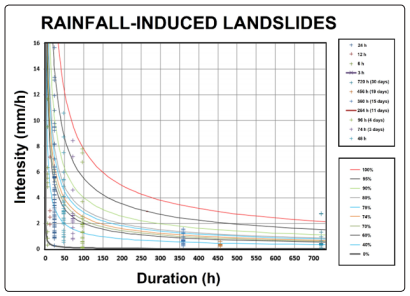
Figure 5: Landslide density curves or probability of landslide
occurrence curves for Rainfall-Induced Landslides - (RainfallInduced Landslides, 1982 - 2019) (Yepes, Mosquera - 2019)
Geomechanical parameters from field investigation
As previously mentioned, the probability model was initially
proposed for large areas of study, like a country. In this scenario,
the use of geomechanical properties is not actually appropriate
because of the scale. That is why, in this research project,
zonation and modeling are treated and analyzed separately. In
this subchapter, the use of strength and strain properties will be
addressed: limit equilibrium to calculate factors of safety and finite
element to study deformations of the two landslides.
Two-dimensional limit equilibrium and finite Element analysis:
using subsurface exploration performed in the two evaluated
landslides and taking information close to surface to focus on local
and surface failures, limit equilibrium and finite element analysis
were performed. The results are presented in the next chapters.
Due to the difficulty to get samples like Shelby tubes to take to
the lab and perform strength and deformability tests, SPT results
are the only available information.
The friction angle was calculated for the identified layers from
SPT results, using correlations that have been proved valid in
Colombia (Gonzalez, 1999). Also, the modulus of elasticity was
calculated from the same SPT results, using correlations from the
accepted literature (Bowles, 2001)
The two analyzed landslides have had problems of stability for
several years. Both this reason and the lack of alternatives of
probabilistic and numerical methods to strictly try to find solutions
to these types of problems, inspired this current project.
Analysis Method
The following information was taken from “Rodriguez and Yepes
(2011)” and complemented throughout this paper. Landslide
hazard was defined as failure probability considering rainfall,
earthquake, and slope susceptibility effects. In this subchapter,
the method used to obtain that probability is briefly explained.
Total probability
Total probability of failure of a given slope is obtained using
Equation 1. Equation one is based on Bayes?s Theorem for
mutually exclusive and independent events: earthquakes and
rainfall.
Pt(F)=P(R)+P(S)-P(R)*P(S) (1)
“Pt (F)” is the total probability of failure, “P(R)” is the probability
of failure due to rainfalls and “P(S)” is the probability of failure
due to earthquakes.
“P(R)” is obtained using Equation 2, where “pr
” is the probability
of occurrence of a given critical rainfall, “pfr” is the probability
that the critical rainfall induces landslide in the slope, and “S” is
a function that defines the slope susceptibility to Land sliding.
P(R)=pr*pfr*S (2)
“P(S)” is obtained using Equation 3, where “ps
” is the probability
of exceedance of a given earthquake magnitude, “pfs” is the
probability that the seismic events induce the slope failure, and
“S” the slope susceptibility. In this paper “S” was consider the
same for rainfall and earthquake-induced landslides.
P(S)=ps*pfs*S (3)
Equations (1), (2), and (3), are probability theory for two events
that are independent and not mutually exclusive. Rainfall and
earthquakes happen to be events with these two specific features.
Results
The probability model presented above and previously applied
to El Salvador (Rodriguez-Yepes, 2011) was applied to the two
problematic and constant landslides also mentioned before,
and located in Pipiral, a small region in Central Colombia. The
following figures show the results of zonation and two-dimensional
analysis.
Landslide hazard Zonation
The following figures show: the probability of failure due to
earthquakes, the probability of failure due to rainfall, and the
total probability including both events as factors that can occur
simultaneously, but with the condition that only one of them will
cause the landslide for a given cell (2.0 * 2.0 m
2
).
Probability of failure due to earthquakes “P(S)”
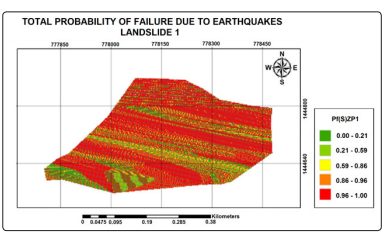
Figure 6: Probability of Failure due to earthquakes for Landslide
1 (Yepes - Mosquera, 2019)
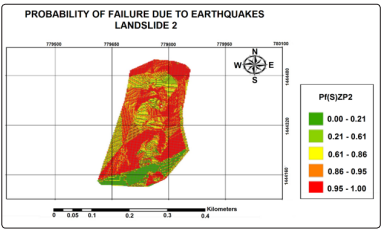
Figure 7: Probability of Failure due to earthquakes for Landslide
2 (Yepes - Mosquera, 2019)
Probability of failure due to rainfall “P(R)”
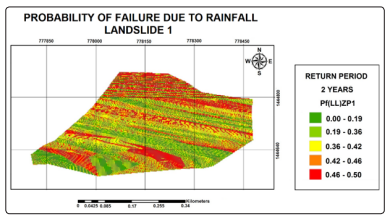
Figure 8: Probability of Failure due to Rainfall for Landslide 1
(Yepes - Mosquera, 2019)
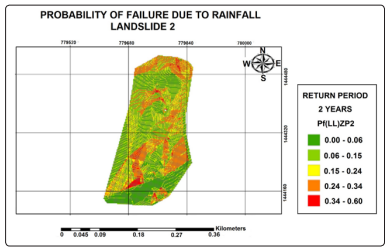
Figure 9: Probability of Failure due to Rainfall for Landslide 2
(Yepes - Mosquera, 2019)
Total Probability of failure “Pt (F)”
The following figure shows the probability of occurrence of the
two events “rainfall and earthquakes”, with the condition that
only one of them will trigger a landslide.
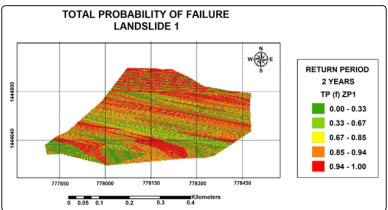
Figure 10: Total Probability of Failure for Landslide 1 (Yepes -
Mosquera, 2019)
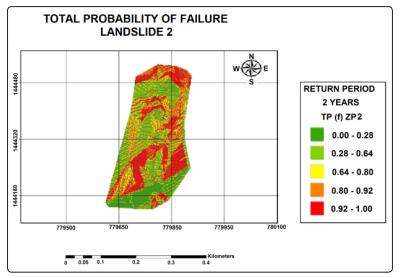
Figure 11: Total Probability of Failure for Landslide 2 (Yepes -
Mosquera, 2019)
Two-dimensional analysis
Table 1 presents the geomechanical properties calculated using
correlations with SPT results.
Table 1: Geomechanical properties for the layers found and
defined with the subsurface exploration
| GEMOECHANICAL
PROPERTIES |
STRENGTH |
DEFORMABILITY |
| MATERIAL |
Φu' (°)
|
Υ (KN/m3
) |
E (kPa) |
G (kPa) |
| Layer 1: residual soil,
fine grained |
27 |
18 |
4045 |
1667 |
| Layer 2: colluvial soil |
29 |
22 |
16502 |
6374 |
| Layer 3: sedimentary
rock |
32 |
24 |
19613 |
7551 |
| Layer 4: igneous rock |
35 |
24 |
19613 |
7551 |
Using the friction angle as the strength property for the factor of
safety, and the modulus of elasticity as the deformability property
for the finite element analysis, the two-dimensional analysis was
carried out. Figure 12 shows, for landslide 1:
• Top - left plan view of Landslide 1. Three sections, the most
critical in red color
• Top - right: Factor of safety for the most critical section. The
lowest factors of safety are close to surface.
• Bottom - left finite element analysis for the most critical
section. Vectors showing the potential direction of the
landslide. Surface stability problem is the most probable
cause.
• Bottom right: location of subsurface exploration.
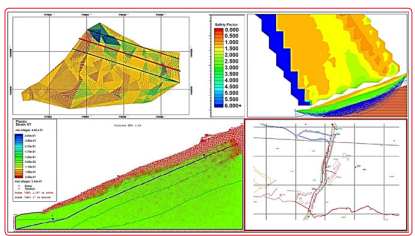
Figure 12: Two-dimensional evaluation. Limit equilibrium and
Finite Element Analysis
For the Finite Element Analysis, as an analysis method that studies
“Stress-strain” behavior before plastic behavior of the slope, each
node of the two landslides has the geomechanical parameters
included in table 1. The deformation vectors in red color shown in
figure 12, present the portion of the slope that has a high potential
of instability. The vectors clearly show that the slope is unstable
close to surface, which is the current and actual geotechnical
behavior of the area.
Figure 13 shows, for landslide 2, factors of safety of 0.748 close
the surface, which indicates problems related with surface stability.
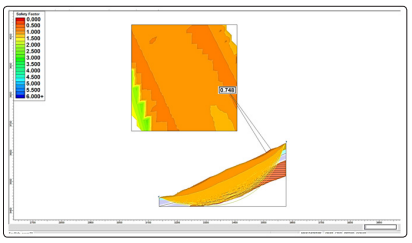
Figure 13: Two-dimensional evaluation. Factor of safety
showing stability problems
For the Limit Equilibrium Analysis, as an analysis method that
studies plastic behavior of the slope, the two landslides have the
geomechanical parameters included in table 1. The factors of safety
shown in figure 13, present the portion of the slope that has a high
potential of instability. The factors of safety clearly show that the
slope is unstable close to surface, which is the current and actual
geotechnical behavior of the area [30-41].
Conclusions
• This application of the model shows it is a coherent approach
to the current reality of the landslides and the reality of the
past few years.
• The probability of occurrence of landslide due to earthquakes
(eq. 3) included in the model (eq. 1), is linked to the seismic
hazard analysis of the evaluated area. The methodology can
be applied to a problematic area where the earthquakes are
frequent triggers of landslides.
• The probability of occurrence of landslide due to rainfall (eq.
2) included in the model (eq. 3), is linked to I-D-F curves
of the evaluated area. The methodology can be applied to
a problematic area where rainfall is a frequent trigger of
landslides.
• The probability model (eq.3) is ideal for regions where
both rainfall and earthquakes are triggers of landslides.
The summation of dynamic geological processes, frequent
rainfall, variable topography, and complicated earth materials
frequently generate landslides around the world.
• Both Finite Element and Limit Equilibrium analysis, although
on a different scale than zonation, show and prove that the
two evaluated areas are in a constant instability.
• It is fundamental to recognize the difference between the
information used for zonation and for modeling. For landslide
hazard zonation, the information is mainly “geologicalseismic-hydrological-topographic”. For two-dimensional
modeling, the information is mainly “geotechnicalpseudostatic-topographic”.
• Even though, zonation and modeling come from different
theoretical and scales scenarios, both show the instability
that is currently occurring and has been occurring for several
years in this specific evaluated area of Colombia.
• The urgent need to keep on using probability and numerical
methods to evaluate hazard and to consequently evaluate
risk, still requires many efforts, new research ideas, and valid
applications from all the professionals involved in these types
of studies. The use of more numerical methods instead of
“qualitative, empirical” methods, increase the odds of having
a better solution of a problem in civil engineering.
• The application of probability methodologies in geotechnical
engineering, as one the numerical options available, is a
genuine way to consider all the variables it is possible to
find in nature.
• The probability of failure due to rainfall has values up to
approximately 60%. This may be influenced by the fact that
IDF information comes from only two rainfall stations that
are close to the two studied landslides.
• The probability of failure due to earthquakes has values
greater than 90%. This may be because the seismic hazard
analysis has information from seven geological faults. Finally,
the total probability of failure has values up to 90% and more.
A conclusion here is that the problems of stability are mainly
caused and influenced by the seismic behavior.
References
- Ankit Sharma, Ujjwal Sur, et al (2020). “Probabilistic
Landslide Hazard Assessment using Statistical Information
Value (SIV) and GIS Techniques. A Case Study of Himachal
Pradesh, India”. Wiley Online Library
- Aneas S (2000) Risks and Dangers, a vision from geography.
Retrieved from: http://www.ub.edu/geocrit/sn-60.htm.
- Baroň I, Kycl P, Hradecký P, Metelka V, Vorel T, et al. (2007)
Identifying the Areas Susceptible to Landsliding And Other
Hazardous Processes In El Salvador, Nicaragua And Costa
Rica, Central America. Proceedings of 1st North American
Landslide Conference, Vail, Colorado.
- Baecher G, Christian J (2003) Reliability and Statistics.
Geotechnical Engineering.
- Benito B, (2009) “Evaluación Regional de la Amenaza
Sísmica en Centroamérica” - Proyect: RESIS II Final Report.
Universidad Politécnica de Madrid, Madrid, Spain. 21p.
- Burbach GV, Forhlich C, Pennington WD, Matumoto T
(1984) Seismicity and tectonics of the subducted Cocos Plate.
J. Geohys. Res., B. 89(B9): 7719-7735.
- Colombian Association of Seismic Engineering [AIS].
Instituto Colombiano de Geología y Minería (1996). “Estudio
general de amenaza sísmica de Colombia. Bogotá”.
- Crone AJ, Baum RL, Lidke DJ, Sather DND, Bradley LA,
et al. (2001) Landslides induced for Hurricane Mitch in El
Salvador-An inventory and descriptions of selected features.
Open-File Report 01-444. U.S. Geological Survey. Denver,
Colorado 24p.
- Christian John, Ladd Charles, Baecher G (1994) Reliability
Applied to Slope Stability Analysis. Journal of Geotechnical
Engineering 120: 2180-2207.
- Chávez Agnes, González F (2018) “Caracterización
mineralógica, porosimétrica, microestructural y con ensayos
convencionales de agregados pétreos gruesos de una cantera
del piedemonte llanero colombiano según norma IDU sección
500-11” (Universidad Católica de Colombia. Trabajo de
postgrado. Bogotá). Retrieved from: https://repository.
ucatolica.edu.co/bitstream/10983/16043/1/Trabajo de Grado_
final.pdf.
- Cortés Ricardo, De la Espriella R (1990) Apuntes sobre la
Tectónica del Valle del Río Negro al Oriente de Cundinamarca.
Geología Colombiana 17: 133-142.
- Dewey JW, Suárez G (1991) Seismotectonics of Middle
America. In Neotectonics of North America, Slemmons et
al. (eds), Geological Society of America, Decade Map 1:
309-321.
- Ering, Sivakumar (2016) Probabilistic back analysis of
rainfall induced landslide- A case study of Malin landslide.
India, June: A case study of Malin landslide.
- Escobar Carlos, Duque G (2017) “Análisis de estabilidad de
taludes”. Retrieved from: https://cutt.ly/3wWPHxF.
- Escobar H.E., Escobar M.R., Rendón J.R., (2003).
“Caracterización geotécnica de las formaciones geológicas
del área metropolitana de San Salvador y aplicación a la
evaluación de amenaza por deslizamientos”. Civil Engineering
Dissertation. Universidad Centroamericana “José Simeón
Cañas”. San Salvador. El Salvador.
- Estrategia Internacional para la Reducción de Desastres de
las Naciones Unidas [UNISDR] (2009) “Terminología sobre
reducción del riesgo de desastres” pp5-42. Retrieved from:
www.preventionweb.net.
- Garzón E (2016) “Propuesta metodológica para la evaluación
de la amenaza de corredores viales de montaña de la red vial
nacional”. In Actas de Ingeniería (Vol. 2). Retrieved from:
http://fundacioniai.org/actas.
- Gomis A (2007) “Localización de terremotos a partir de
formas de onda”. Retrieved from: https://cutt.ly/cwWhf2X.
- Gutenberg B, Richter C (1954) Seismicity of the Earth and
Associated Phenomena.
- Hadj-hamou T, Kavazanjian E (1985) Stability of Gentle
Infinite Slopes. Journal of Geotechnical Engineering, ASCE
111: 681-697.
- Harr M (1987) Reliability Based Design in Civil Engineering.
In McGraw Hill.
- Instituto Nacional de Investigaciones Geológico
[INGEOMINAS] (1998) Memoria Explicativa Geología
plancha 266 Villavicencio. Villavicencio, Meta:
INGEOMINAS.
- Instituto Nacional de Vías [INVIAS] (2013) Plancha 266
Villavicencio. Plano Geología Regional Sitios Críticos PR
82+410 a PR 93+500. Villavicencio, Meta.
- Jiménez Gabriel, Viáfara J (2011) “Análisis 3D de drenes
horizontales para la estabilización de taludes”. https://
repository.javeriana.edu.co/bitstream/handle/10554/7305/
tesis507.pdf?sequence=1&isAllowed=y.
- Keefer DK (1984) Landslides caused by earthquakes.
Geological Society of America Bulletin 95: 406-421.
- Mesa Milena, Tejeda E (2018) “Análisis de la estabilidad de
taludes en terraplenes mediante los métodos de equilibrio
límite y el método de elementos finitos”. Revista Cubana de
Ingenieria, IX 1: 49-56.
- Mora S, Vahrson W (1994) Macrozonation Methodology for
Landslide Hazard Determination. Bulletin of the Association
of Engineering Geology 31: 49-58.
- Paris, Gabriel; Romero, J. (1994). “Fallas activas en
Colombia (Vol. 34)”. Retrieved from: https://www2.sgc.
gov.co/Publicaciones/Cientificas/Seriadas/Documents/
BoletinVolumen34No2-3.pdf.
- Rodríguez C, Torres A, Leon E (2004) Landslide Hazard in
El Salvador. Procecedings of ECI Conference on Geohazards
1-10.
- Rodríguez C (2003) Models for Earthquake and Rain Induced
Landslide. Universidad Nacional De Colombia. Norwegian
geotechnical Institute. Trabajo de postgrado. Bogotá.
- Rodríguez M (2005) Tectónica de placas. In Biología marina
y oceanografía: Geomorfología y tectónica de placas (p. 124).
Retrieved from: https://cutt.ly/DwImx48.
- Rodríguez CE (2001) Hazard assessment of earthquakeinduced landslides on natural slopes. PhD Thesis. Imperial
College, University of London, London, UK.
- Rodriguez CE (2007) Earthquake-induced Landslides in
Central America. Central America Geology Resources
Hazards. Bundschuh J, Alvarado GE (eds). Taylor and Francis
London 1331p.
- Rueda K, García H, Teheran K, Torrenegra W (1988) Sistema
de fallas Guaicaramo. Servicio Geológico Colombiana.
Retrieved from: https://cutt.ly/ZwImNVo.
- Saro Lee and Biswajeet Pradhan (2006) “Probabilistic
landslide hazards and risk mapping on Penang Island,
Malaysia”. Journal of Earth System Science
- Sen Cai Jing, Jim Yeh Tian, Yan E, Hong Hao Yong, Yang
Huang Shao, et al. (2017) Uncertainty of rainfall-induced
landslides considering spatial variability of parameters.
- Strauch R, Istanbulluoglu E, Riedel J (2019) “A new approach
to mapping landslide hazards: a probabilistic integration of
empirical and physically based models in the North Cascades
of Washington, USA”. Natural Hazards and Earth System
Sciences
- Sheng Fu, Lixia Chen, et al. (2020) “Landslide hazard
probability and risk assessment at the community level: a
case of western Hubei, China. Natural Hazards and Earth
System Sciences.
- Vega, Johnny, Hidalgo C (2014) “Estimación de la amenaza
por deslizamientos detonados por sismo y lluvia”. Revista
EIA 11: 103-117.
- White RA, (1991) Tectonic implications of upper-crustal
seismicity in Central America. Neotectonics of North America,
Slemmons et al. (eds), Geological Society of America, Decade
Map 1: 323-338.
- Yepes JE, (2009) Implementacion De Un Modelo Estocástico
Para Evaluar Amenaza De Deslizamientos. MSc Dissertation.
Universidad Nacional de Colombia, Bogotá, Colombia.
View PDF