Author(s): Ibrahim Sylvester
Modified Sequential probability ratio test (MSPRT) technique helps to increase the reliability and speed of stabilization detection on the Non homogenous
poison process (NHPP) with the maximum number of software faults to reduce error between the consumer risk and producer risk, with the time cumulative
system of hours. Modified sequential probability ratio test can be used to reduce the average sample size required to perform statistical hypothesis tests
at specified levels of significance and power. The proposed result suggests MSPRT along with maximum number of faults contained in software would be
useful in speeding up decision making while dealings error in a software reliability weekly index, we show the graphical performance of the MSPRT and
average sample number (ASN).
Acceptance sampling plans is an inspection procedures and decision making used to determine whether to accept or reject a lots this involves both the producer (supplier) of product and the consumers (buyers). Consumers need acceptance sampling to limit the risk for rejecting a good quality material or accepting bad quality product. Consequently, the consumers, sometimes in conjunction with the producers through contractual agreements, specified the parameter of the plan, any company can be both a producer of product purchased by another company and a consumer of a products or raw material supplied by another Montgomery [1].
The Modified Sequential Probability Ratio Test (MSPRT) was developed by Abraham Wald more than a half century ago. It is widely used in quality control in manufacturing and detection of anomalies in medical trials. In this article, we will explain the theory behind this method and illustrate its use Wald [2]. In particular they stated that a sequential test procedure might be constructed that would control error to the same extent as the best current procedure based on a predetermined number of trials. In probability theory and statistics, a probability distribution is a mathematical function that gives the probabilities of the occurrence of different possible outcomes in experiment which described all the possible values and likelihood that a random variable can take a range. This range can be bounded between the minimum and maximum possible values Madison [3].
First idea of a sequential sampling plan test procedure goes back to Dodge who constructed a double sampling procedure [4].
According to this scheme, the decision whether or not a second sample should be drawn depends on the observations of the first sample.
An Enhanced Evaluation Method of Sequential Probability Ratio Test on Accurate event detection has high priority in many technical applications. Events in acquired data series, their duration, and statistical parameters provide useful information about the observed system and about its current state.
Steland derive new acceptance sampling plans that control the overall operating characteristics, the acceptance sampling in particular a modified sampling and the case on the accuracy for spatial batch sampling on the accuracy of the estimation [5]. Lens and Wilrich propose a simple and easy to design, special case of sequential sampling plans by attribute, name cseq-1 sampling plans having acceptance numbers not greater than one, and analyzed the properties of these plans compare them to the properties of the widely used of sampling procedures [6]. Aslam and Ali propose the acceptance sampling plans as an important field of Statistical Quality Control (SQC) to inspect the final product before it can be realized for consumer’s use, the testing of items including computers, mobile phones, and automobiles need the acceptance sampling plans schemes to solve the life testing problems [7]. Other procedures and the consumers need efficient acceptance sampling plans schemes. Singh, et al. considered repetitive acceptance sampling for truncated life test in which the life time of the product follows the generalized Pareto distribution in which the plan requires less sample size than the acceptance sampling plans [8]. Zoramawa, et al. comes up with a procedure for computing double acceptance sampling based on truncated life tests on inverse Rayleigh distribution operation characteristic curve and Average Sample Number (ASN) which was best fit than the single acceptance sampling plan in which the decision of the first and second is combined in order to reach a decision whether to accept or reject the lot, Zoramawa and Gulumbe proposed a sequential sampling plan for a truncated life test using a Rayleigh distribution from a designed double sampling plans and specified the consumer and producer confident level [9-10].
MSPRT was originally developed as an inspection tool to determine whether a given lot meets the production requirements or needs. Basically, a sequential test is a method by which items are tested in sequence (one after another). The test results are reviewed after each test. Two tests of significance are applied to the data accumulated up to that time for the average fault time module1 and 2 in Mengmeng & Hoang software reliability measure base on failure intensity.
Assuming two suppliers of product provide the same component to a company. Although the components from the two companies look exactly the same, their lifetime distributions are different. Components from first supplier M have a mean life of μ1 = 15, and components made by supplier N have a mean life of μ2 = 20. We want to determine if the components are from supplier M or from supplier N by conducting a test. The test should meet the following requirements
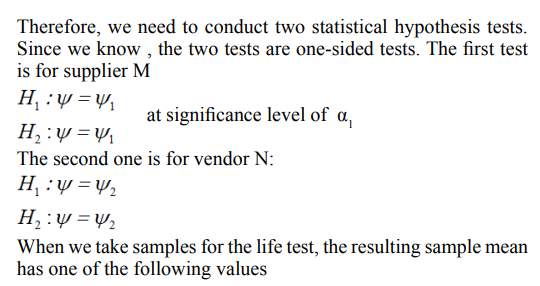
When we take samples for the life test, the resulting sample mean has one of the following values
With more and more samples, the sample mean will be closer to the true population mean. The test will end with a conclusion either from supplier M or from supplier N. This is the principal behind a sequential test. A sequential probability ratio test is based on this idea.
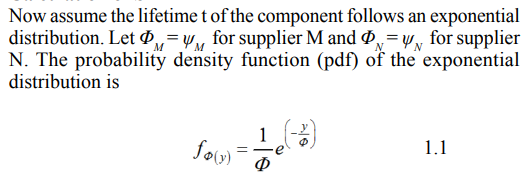
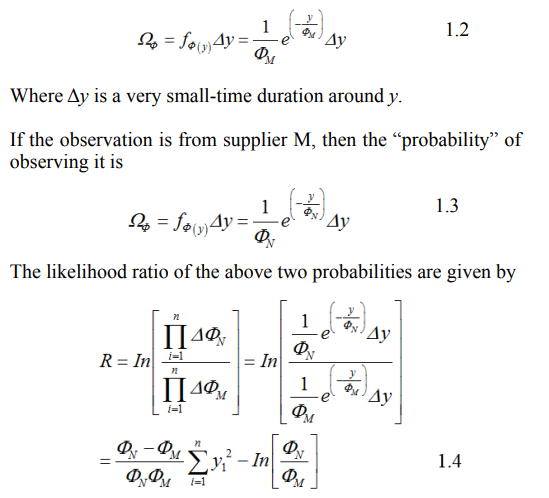
For an observed failure time t, if it is from supplier M, then the “probability” of observing it is
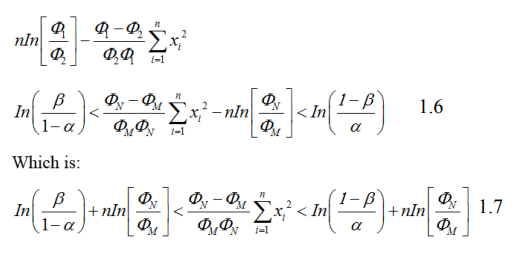
When designing an item-by-item sequential sampling plan, four parameter of the AQL, the producer’s risk α (the probability of rejecting a lot with AQL quality), LTDP and the consumer’s risk β (the probability of accepting a lot with LTDP quality) must be determined prior to determining the acceptance and rejection line. Both the acceptance and rejection number must be integer, the acceptance number is the next integer less or equal to, and the rejection number is the next integer greater than or equal to Y2 .
Consider the ratios for SPRT the constant M and N are approximated by
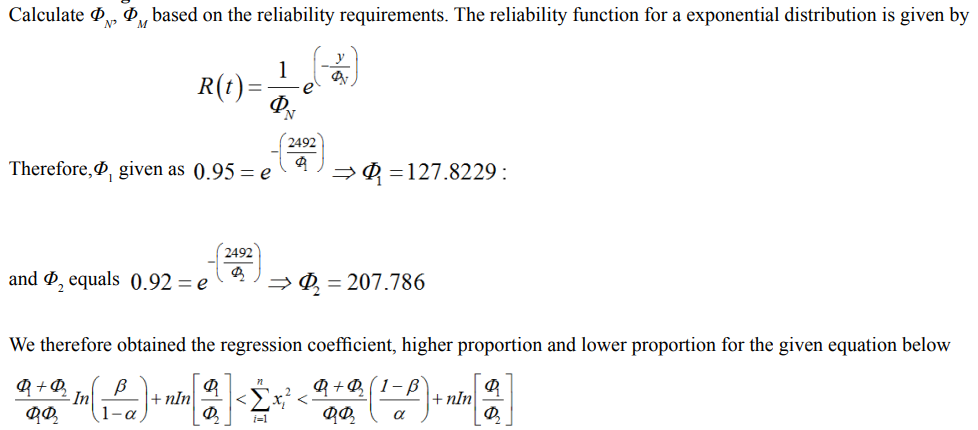
Assuming the lifetime of a product is described by a exponential distribution. We will use SPRT to determine if the product meets the following reliability requirements
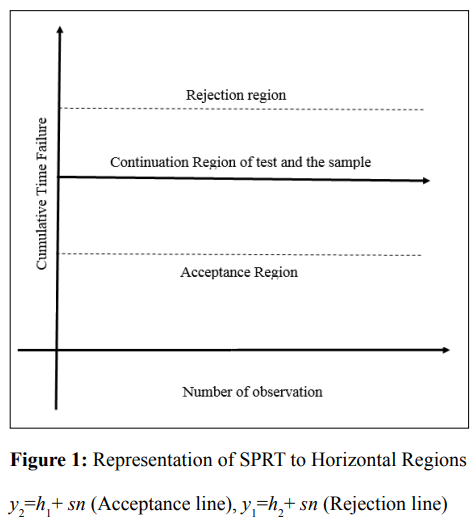
Vertical axis is the total number of observed non-conforming items, and then the operation procedure is given in the following
a)If the plotted point falls within the limit lines the process continues by drawing another sample
b)When the plotted points fall on or above the upper line, the lot is rejected
c)When the plotted points fall on or below the lower line, the lot is accepted
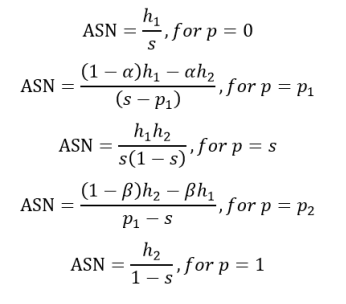
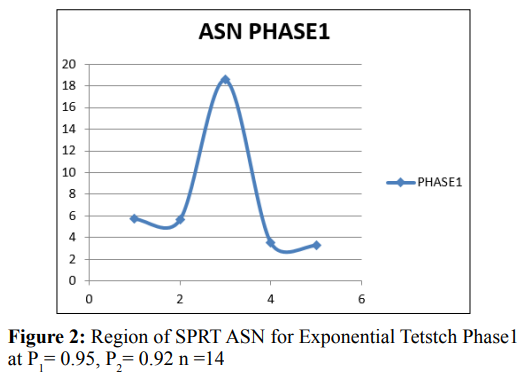
The function plots the average sample size required before the null hypothesis is either is accepted or rejected as the function of the true value parameter being tested.
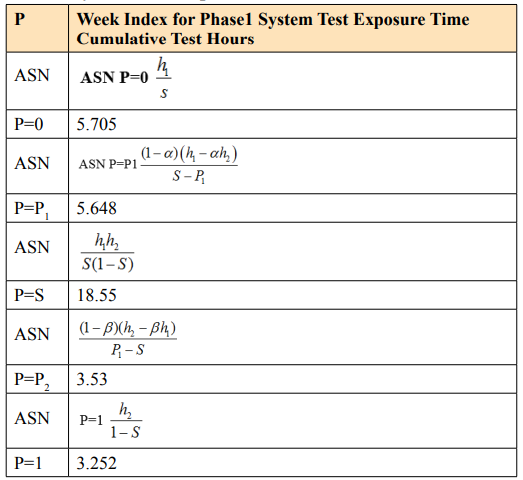
The ASN can be plotted from the following fixed points
We consider week index for PHASE1 of system test data for exposure time cumulative system test hours from the software reliability model with time dependent fault detection and fault removal Mengmeng & Hoang. We are going to consider the sample of 14week index out of 21week index and take the average life truncated hours of 2492 [11-18].
Table 1: Number of Observations from Phase1 of System Test Hours

Table 2: Exponetial Function Representation of SPRT Template Result
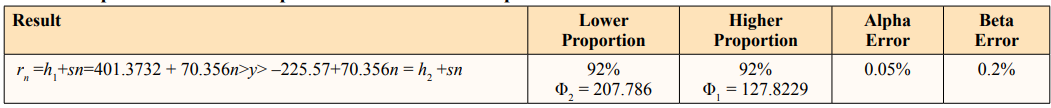
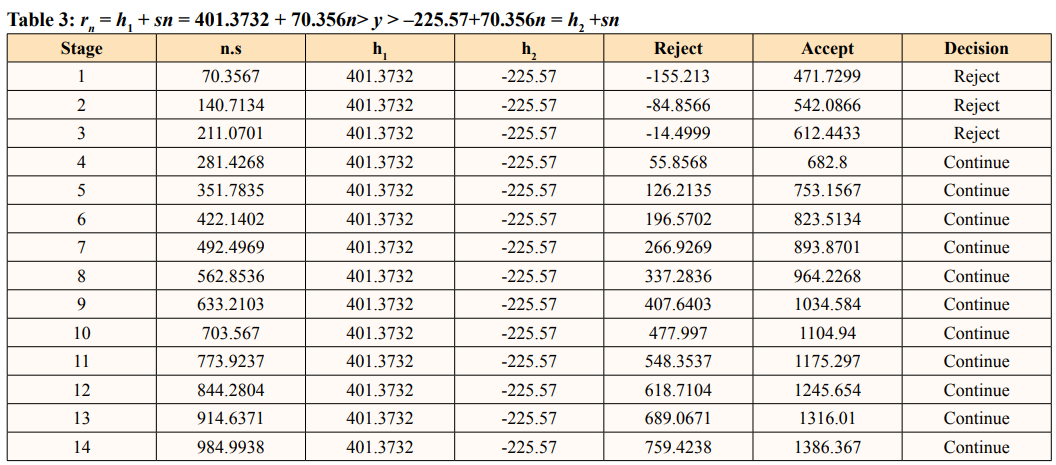
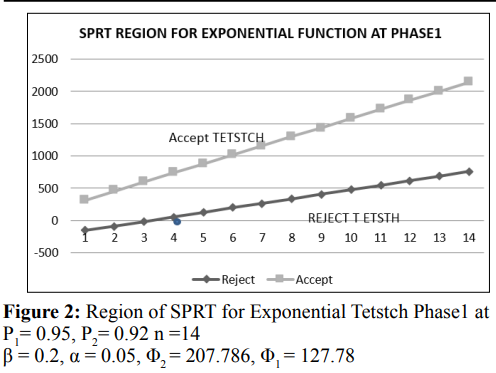
At 14 trials observation test for exponential distribution function with SPRT for phase1 of system fault time less than 759.4238 and 1386.367 are Positive, more than continue are positive. But it shows Rejection, at stage one, two and three terminate stage accept no difference.
Table 4: Average Sample Number (ASN) Week Index for Phase1 System Test Exposure Time Cumulative Test
Sequential stage sampling plans test (SPRT) can have substantial time and resources which provide an alternative to fixed sample plans that can help to reduce the producer and the consumer risk for reaching a wrong decision. The proposed plan is useful in minimizing both the producer’s and consumer’ risk, however we consider exponential families function and fit the model with the sequential function and we show the graphical performance of SPRT with exponential function, average sample number where also computed and plot. The proposed plan yields the minimum efficient until a decision is made on the lot or process sampled, after each item is taken, a decision is made to accept, reject or continue sampling.
1.Montgomery DC (2013) Statistical quality control: a modern introduction.7th ed.,wiley
2.Wald A (1947) Sequential Analysis. John Wiley and Sons.
3.Madison J (2013) M&M Color distribution analysis. http:// www.ask.com/question/what-percentage -distribution -analysis/
4.Dodge HF (1943) A sampling inspection plan for continuous production. Annals of Mathematical Statistics 14: 264-279.
5.Steland A (2015) Sampling Plans for Control-Inspection Schemes Under Independent and Dependent Sampling Designs with Applications to Photovoltaics. Frontiers in Statistical Quality Control 11: 287-317.
6.Olgierd Hryniewicz (2006) Optimal Two-Stage Sequential Sampling Plans by Attributes Frontiers in statisitical quality control 8. https://link.springer.com/ chapter/10.1007/3-7908-1687-6_2
7.Aslam M, Ali MM (2019) Testing and inspection using acceptance sampling plans. doi.10.1007/978-981-13.9306-8.
8.Singh N, Kaur H (2019) Acceptance sampling plans for truncated life test have generalized Pareto distribution. Life cycle reliability and safety engineering 8: 151-156.
9.Zoramawa AB, Gulumbe SU, Kantam RRL, Musa, Y (2018) Developing double acceptance sampling plans for percentiles based on inverse Rayleigh distribution. International Journal of Statistics and Applied Mathematics 3: 39-44.
10.Zoramawa AB, Gulumbe SU (2021) On sequential probability sampling plan for a truncated life test using inverse Rayleigh distribution. Asian Journal of Probability and Statistics 15: 1-7.
11.Rosaiah K, Kantam R, Kumar S (2006) Reliability Test Plans for Exponentiated Log-Logistic Distribution. Economic Quality Control 21: 279-289.
12.Rosaiah K, Kantam R, Prasad S, Reddy J (2008) Reliability Estimation in Type-II Generalized Log-Logistic Distribution. International Journal of Agricultural and Statistics Sciences 4: 283-292.
13.Wald A, Wolfowitz J (1948) Optimum Character of the Sequential Probability Ratio Test. Annals of Mathematical Statistics 19: 326-339.
14.Walter B (1943) Multiple Sampling with Constant Probability. The Annals of Mathematical Statistics 14: 363-377.
15.Yahya C (2007) Using Artificial Neural networks for the modelling of a distillation column. International Journal of Computer Science & Applications 4: 119-133.
16.Zoramawa AB, Musa, Y, Usman U (2018) Double acceptance sampling plans based on truncated life tests for inverse Rayleigh distribution. Continental J Applied Sciences 13: 18-28.
17.Anderson TW (1960) A Modification of the Sequential Probability Ratio Test to Reduce the Sample Size. The Annals of Mathematical Statistics 31: 165-197.
18.Sandipan Pramanik, Valen E Johnson, Anirban Bhattacharya (2021) A modified sequential probability ratio test. Journal of Mathematical Psychology 101: 102505.
19.Rosaiah K, Kantam RRL (2005) Acceptance sampling plan on the inverse Rayleigh distribution. Economic quality control 20: 277-286.
View PDF