Author(s): Balasubrahmanya Balakrishna
Ensuring the reliability and performance of AWS Lambda functions is contingent upon effective observability as serverless computing becomes an essential component of contemporary application development. This paper explores the crucial function of logging in AWS Lambda and clarifies its importance to observability. The importance of serverless systems and the difficulties they provide for conventional monitoring techniques are discussed in the introduction. The paper clarifies the core ideas of observability and places them in the context of the event-driven paradigm of AWS Lambda.
Highlighting the interaction with CloudWatch Logs, the paper delves into the native logging features of AWS Lambda. It offers best practices for optimizing logging strategy, such as using structured logging and taking asynchronous and distributed systems into account.
The study highlights the concrete influence of observability on system reliability by presenting case studies from real-world scenarios in which efficient logging in AWS Lambda was crucial in locating and fixing problems. To address the changing requirements of serverless application development, the conclusion highlights the current issues and potential developments in AWS Lambda logging and calls for more investigation and study.
AWS Lambda's sophisticated architecture and event-driven execution methodology, inherent to the serverless design, present a novel approach to developing applications. Even though Lambda has a built-in logging interface with AWS Cloud Watch, its proper use necessitates a sophisticated grasp of its advantages and shortcomings. With a particular emphasis on logging, this article explores the landscape of AWS Lambda observability, removing any confusion and providing strategies for success.
Lambda, by default, seamlessly integrates with AWS Cloud Watch for logging. However, ensuring that functions have proper permissions to emit these logs is critical. Even if a Lambda function doesn't explicitly emit logs, Lambda captures essential data about invocations, a facet that will be explored in detail throughout this series. The platform captures standard output (STDOUT) and standard error (STDERR) streams, providing a comprehensive view of function execution.
Although engineers can utilize pre-existing runtime-logging frameworks, this paper clarifies, certain limitations linked to conventional logging libraries. Crucial concerns arise around how easy it is for humans to read log lines and how best to optimize them for search engines. We address these issues by delving into the application of JMES Path for effective log stream searches and investigating extra data that shows up in log lines in the Lambda space that becomes useful.
This article presents AWS Lambda Power tools, a robust library that streamlines the intricacies of logging in recognition of the necessity for structured logging. Lambda power tools provides a high-level overview of its features and how it contributes to structured and relevant logs in the AWS Lambda environment, freeing engineers to concentrate on business requirements by abstracting away the heavy lifting. This exploration aims to provide developers with the skills and information necessary to fully utilize AWS Lambda logging for reliable observability in serverless architectures.
Logs are produced in a particular format for every function call. START, END, and REPORT log lines are standard for function invocation with RequestId that ties an invocation, as shown in Figure 1
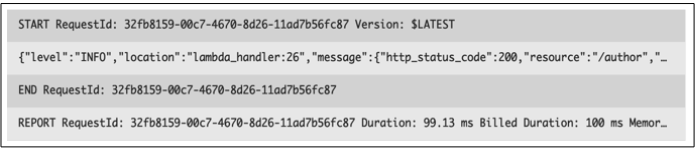
Figure 1: AWS Log lines - START, END and REPORT
These logs' REPORT line, sample shown in Figure 2, which offers thorough information on the function call, is crucial:
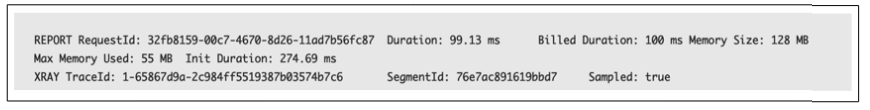
Figure 2: AWS Log REPORT line
Figure 2 shows the function execution lasted 99.13 ms, utilized 55 MB of memory, and had a configured memory setting of 128MB. The presence of Init Duration indicates that this invocation was a cold start.
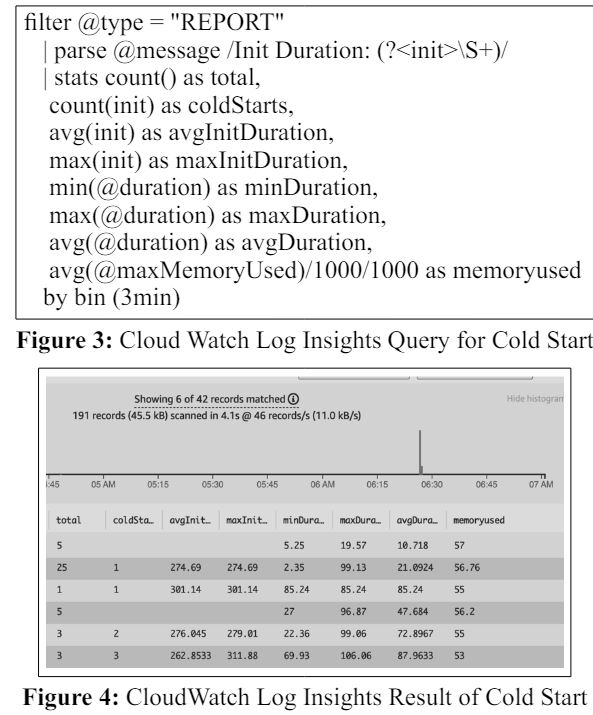
The scant information from this one invocation emphasizes the necessity of thoroughly analyzing all invocations to identify any patterns. This study aims to identify patterns without the laborious process of going through Lambda logs by hand. Alternatively, use CloudWatch Log Insights methodically sift through all logs and spot patterns [1]. The given query calculates metrics for wellinformed decision-making on the function, focusing on cold starts. To simplify statistical calculations, the query, shown in Figure 3, splits the data into 3-minute periods and selectively analyzes the REPORT line, screening for the presence of Init Duration, which is suggestive of cold beginnings.
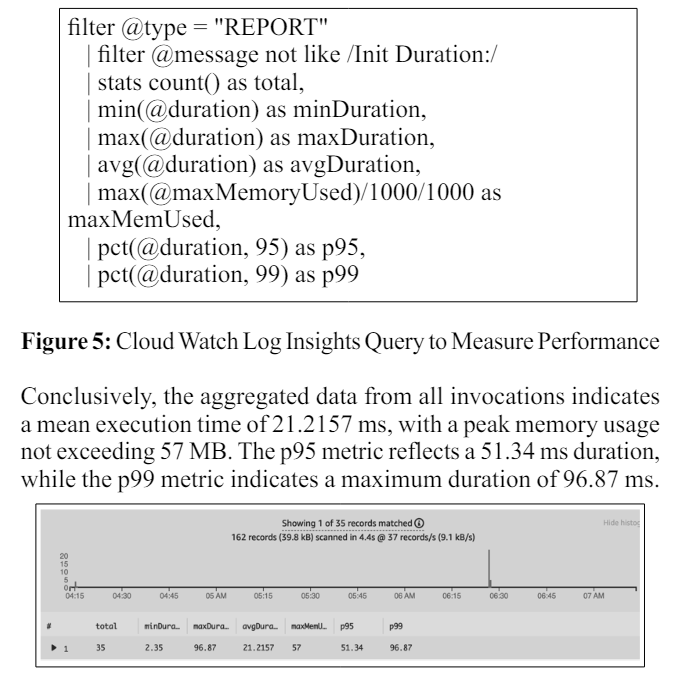
Let's enhance the previous query, illustrated in Figure 5, to identify all warm starts within the same log stream and assess the performance of the functions. The addition of p95 and p99 aims to provide a nuanced perspective on performance metrics.
The above illustration explores the capability of JMES Path within Cloud Watch Log Insights, emphasizing its role in enhancing the search and analysis of log streams. By leveraging JMES Path queries, users can pinpoint relevant data, filter logs based on specific criteria, and extract meaningful information, ultimately facilitating a more efficient and targeted approach to log analysis within the Cloud Watch environment.
Employing a conventional logging library in any programming language for Lambda functions necessitates extra effort to render logs queryable. Inadequate implementation could adversely affect the performance of the Lambda function. To illustrate, Python's standard logging library inherently involves acquiring and releasing a master lock on the thread to process log responses. Manual tuning becomes imperative to guarantee the output adheres to JSON syntax, allowing seamless querying via Cloud Watch Insights. This process also involves auto-discovering fields, ensuring their immediate accessibility for search functionalities [2].
The aws-lambda-power tools for Python Logger simplifies the configuration requirements for producing compliant records while augmenting the features usually associated with the stdlib logging library [3]. All you need to do is give the Logger the native dictionary you want to log and it will take care of the rest, automating the procedures of stream configuration, tracing, and serialization following AWS best practices. This method adheres to recommended principles for AWS Lambda functions and provides a more transparent and effective solution to handle logging tasks
Following are some visible benefits of using AWS power tools for Lambda:
AWS Lambda logging is essential to serverless architectures' successful observability. Although native CloudWatch integrations provide a starting point, problems occur with manual parsing and the best possible log structure. These intricacies are simplified using AWS Lambda Powertools, guaranteeing adherence to AWS standard practices. While Powertools and other tools provide automatic log discovery and serialization, the strength of JMESPath in CloudWatch Log Insights improves search possibilities. Through comprehension of Lambda logging intricacies and the adoption of purpose-built solutions, developers may extract pragmatic insights, execute efficient troubleshooting, and enhance serverless function performance for an application environment that is more robust and expandable.