Author(s): Balasubrahmanya Balakrishna
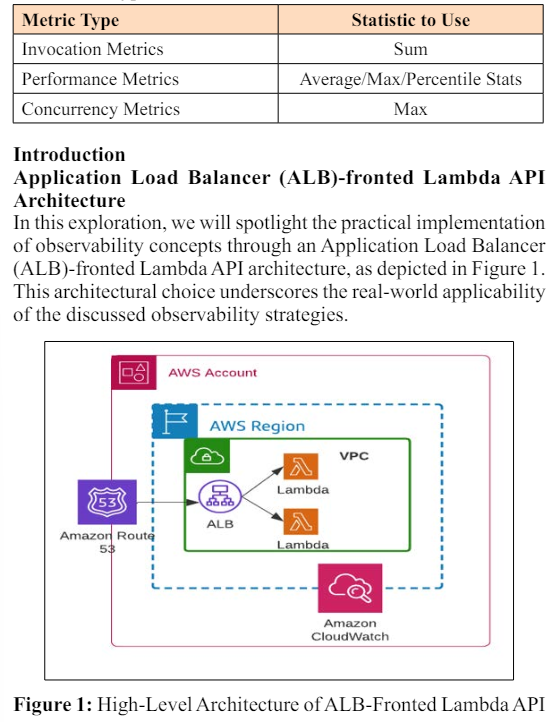
The importance of observability in AWS Lambda systems is examined in this technical article, which focuses on using Python and the AWS Lambda Powertools to improve monitoring capabilities. With serverless computing, AWS Lambda has emerged as a critical service that lets developers concentrate on writing code rather than maintaining infrastructure. Nonetheless, troubleshooting, performance improvement, and guaranteeing the dependability of serverless apps depend on effective observability. Using specially designed Python Serverless Restful API and AWS Lambda Powertools, this article thoroughly analyzes important AWS Lambda metrics, their interpretation, and techniques to improve observability while running serverless applications in the AWS Lambda environment. The author will use Python with the AWS Lambda Powertools, implemented as a Lambda layer, to facilitate seamless integration for custom metrics and advanced observability features.
Two methods are available with AWS Lambda for gathering and examining metrics:
Without requiring any setup, the default configuration streamlines the monitoring process for users by automatically gathering and presenting critical metrics [1].
AWS Lambda allows users to set custom metrics for more customized observability [2]. By allowing the gathering of particular data points, this option makes it possible to monitor and analyze data in a more detailed and unique manner.
Provides information about the outcome of an Invocation. E.g., Invocations, Errors, Throttles, Dead Letter Errors, Destination Delivery Failures, Provisioned Concurrency Invocations, Provisioned Concurrency Spillover Invocations.
• Dead Letter Errors and Destination Delivery Failures are applicable for Async invocations
Provides data about the performance outcome of a single invocation. E.g., Duration, Post Runtime Extension Duration, Iterator Age, Offset Lag
Provides data about the aggregate count of instances processing events.
E.g., Concurrent Executions, Provisioned Concurrent Executions, Provisioned Concurrency Spillover Invocations, Provisioned Concurrency Utilization, Unreserved Concurrent Executions.
Metrics come with predefined retention and resolution periods, as shown in the table below:

Initially, data points published at a shorter interval undergo aggregation for prolonged storage. As an illustration, when data is gathered at a 1-minute frequency, it remains accessible at a 1-minute resolution for 15 days. Following this initial period, the data persists but undergoes further aggregation, retrievable only at a 5-minute resolution.
Beyond the 63-day mark, the aggregated data experiences another level of consolidation, becoming accessible with a 1-hour resolution. These evolving resolutions cater to different needs over time, balancing granularity with long-term storage efficiency
Furthermore, the metrics maintain a retention period of 15 months before entering a rolling-out phase. This structured approach to data retention ensures a balance between historical depth and resource optimization.
The table below provides the appropriate usage of statistics for each metric type:
The key AWS Lambda metrics, their interpretation, and strategies to elevate observability throughout this paper. By utilizing Python and AWS Lambda Powertools, the aim is to empower developers and system administrators with practical insights into building resilient, high-performing, serverless applications. The chosen architectural context and purpose-built function serve as tangible examples of the efficacy of these observability strategies in realworld scenarios.
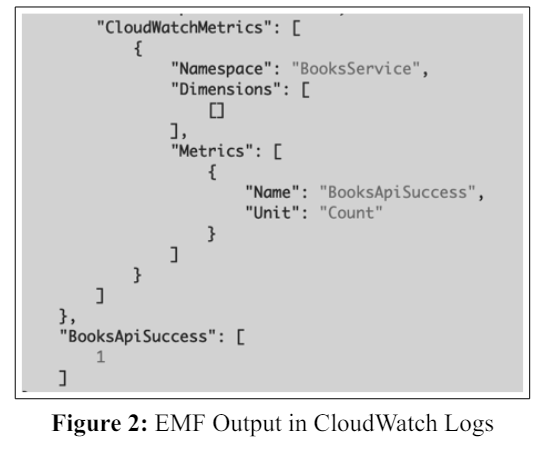
Custom metrics can be generated inside a chosen namespace by facilitating the ingestion of logs containing application data using the CloudWatch Embedded Metrics Format (EMF)[3]. These customized metrics are crucially produced asynchronously. A single EMF object can aggregate 100 metrics within a custom namespace. It is not recommended to synchronously report a statistic to CloudWatch Metrics since it hurts function scalability and code performance. Steer clear of such methods.
It is highly advised for developers working with Python, Typescript, or Java to utilize AWS Lambda Powertools [4]. This toolbox offers a lot of functionality, including analytics, tracing, logging, and other features. Most notably, it makes it possible to generate logs in the proper EMF format quickly.
Although Metric Math is a feature often disregarded, it is more comprehensive than AWS Lambda and Amazon CloudWatch [5]. Once a measure is recorded in CloudWatch, you can use mathematical expressions to create new time series based on the existing metrics, whether custom or built-in. One well-known example in AWS Lambdas is calculating the mistake rate by dividing the Errors metric by the Invocation metric. Metric analysis gains further adaptability by allowing alarms to be created using metrics-related math calculations.
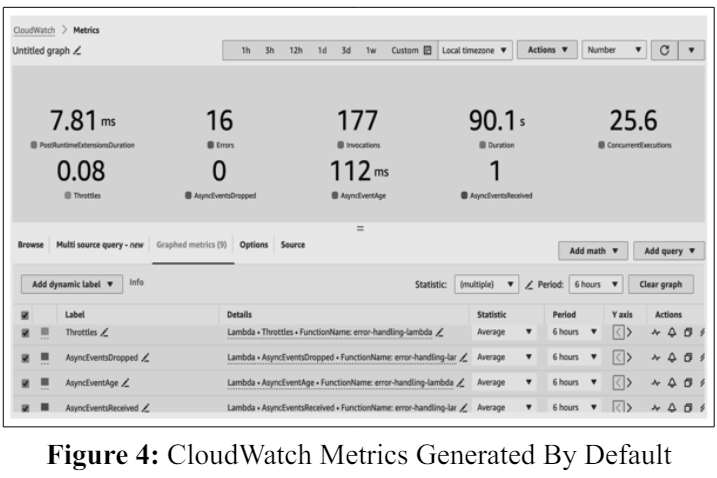
The default metrics (Figure 4) are automatically generated as part of the default behavior when the Application Load Balancer (ALB) executes the sample API using AWS Powertools for Python, shown in Figure 3. As the code shows, custom metrics have yet to be expressly defined.
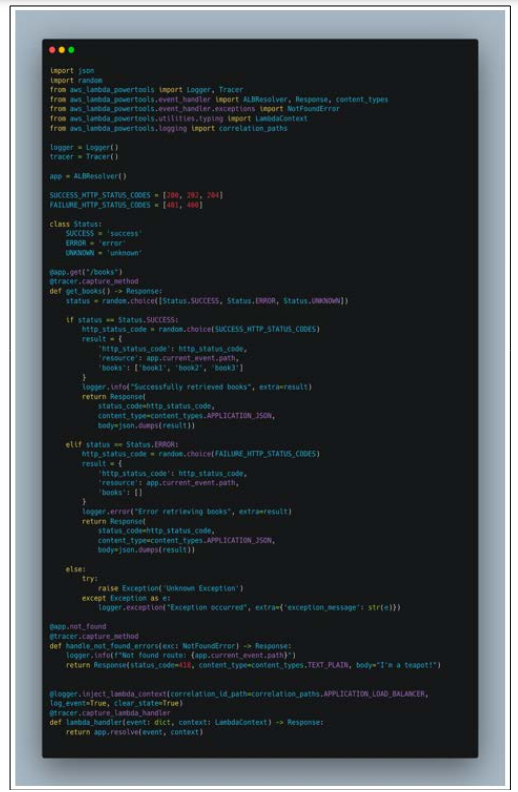
Figure 3: Purpose-Built Lambda Function with AWS Powertools
Augment the code mentioned above by introducing custom metrics to gain deeper insights into business-level metrics. The modified code snippet below (Figure 5) demonstrates the incorporation of custom metrics. It's important to note that this example merely scratches the surface of the extensive capabilities that Powertools offers for accomplishing a wide range of tasks.
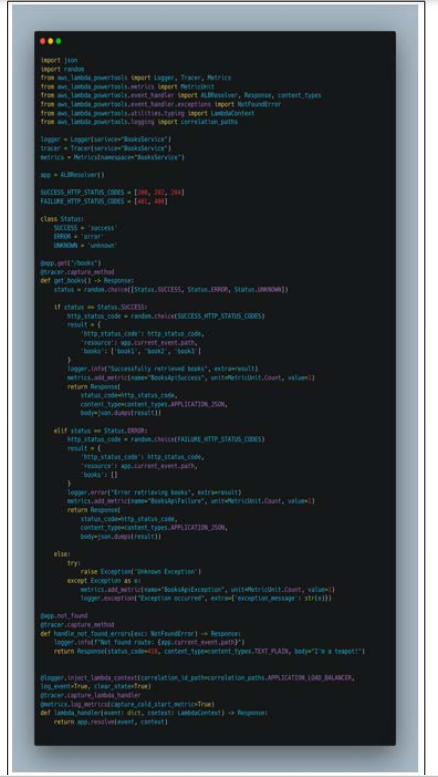
Figure 5: Modified API with Custom Metrics
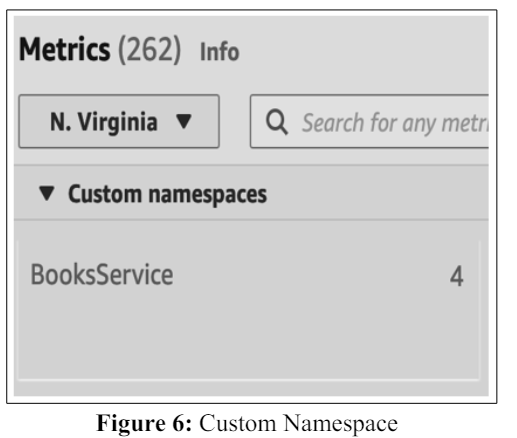
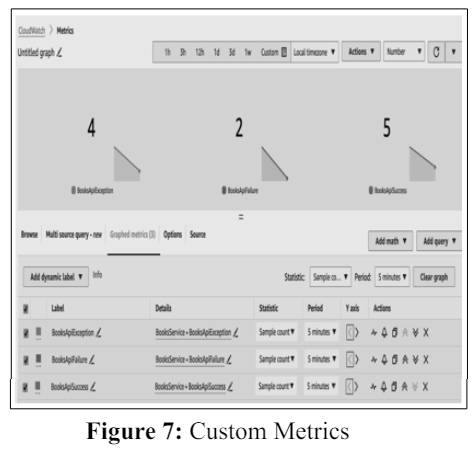
Within the code, we have established a custom namespace labeled BooksService and populated it with business-level metrics. Figure 6 and Figure 7 below illustrate the specific metric within this custom namespace.
AWS Lambda is a critical player in the serverless computing space, freeing developers from the burden of managing infrastructure in favor of writing code. This exploration of observability optimization in AWS Lambda environments has revealed a variety of tactics meant to improve accuracy and efficiency. Exploring default metrics categories like Performance, Concurrency, and Invocation has helped us establish a solid foundation for debugging and monitoring
Furthermore, a potentially has appeared with the advent of AWS Lambda Powertools, which are smoothly linked with Python. One helpful step toward a more sophisticated observability framework is using the CloudWatch Embedded Metrics Format (EMF) and the advice to use Powertools for metric creation, tracing, and logging
Beyond the technical details, investigating Metric Math capabilities and adding custom metrics under a namespace designated explicitly for them (such as "BooksService") highlight the breadth of analysis possible with AWS Lambda and CloudWatch.
As we go through the observability's complexities, it is clear that this journey is about more than just measurements and codes-it's about making decisions based on intelligent facts. Refinements for optimal system knowledge and responsiveness are prioritized, whether avoiding anti-patterns like synchronous metric publication or utilizing Metric Math for meaningful computations.
Essentially, the cooperative synergy of AWS Lambda, CloudWatch, Python, and Powertools provides a comprehensive approach to observability, which guarantees the identification of problems and proactive optimization for continued performance. Developers and system administrators can create a serverless environment that functions effectively and changes dynamically in response to the needs of the applications it supports by following best practices, avoiding hazards, and utilizing the capabilities offered. Pursuing increased observability is a process rather than a destination, and this investigation is the first step toward a day when AWS Lambda applications function at their best.