Author(s): Gerald C. Hsu
The author was inspired from reading two recently published medical papers regarding pancreatic beta cells insulin secretion or diabetes reversal via weight reduction. The weight reduction is directly related to the patient’s lifestyle improvement through diet and exercise. He has published six medical papers on beta cells based on different stages in observations of his continuous glucose improvements; therefore, in this article, he will investigate food ingredients, meal portions, weight, and glucose improvement based on his 10+ years of collected big data
Here is the Summary Of His Findings
1. His successful weight reduction, from 220 lbs. in 2010 to 171 lbs. in 2020, comes from his food portion reduction and exercise increase.
2. His lower carbs/sugar intake amount, from 40 grams in 2010 to 12 grams in 2020, is resulted from his learned food nutrition knowledge and meal portion reduction, from 150% in 2010 to 67% in 2020.
3. His weight reduction contributes to his FPG reduction, from 220 mg/dL in 2010 to 104 mg/dL in 2020. His carbs/sugar control and increased walking steps, from 2,000 steps in 2010 to ~16,000 steps in 202, have contributed to his PPG reduction, from 300 mg/dL in 2010 to 109 mg/dL in 2020. When both FPG and PPG are reduced, his daily glucose is decreased as well, from 280 mg/dL in 2010 to 108 mg/dL in 2020.
4. His damaged beta cell’s insulin production and functionality, most likely, have been repaired about 16% for the past 6 years or 27% in the past 10 years at a self-repair rate of 2.7% per year.
The conclusion from this paper is a 2.7% annual beta cells selfrepair rate which is similar to his previously published papers regarding his range of pancreatic beta cells self-recovery of insulin secretion with an annual rate between 2.3% to 3.2%.
To date, the author has written seven papers discussing his pancreatic beta cell’s self-recovery of insulin secretion. In his first six papers (see References 2 through 7), he used several different “cutting angles” or “analysis approaches” to delve deeper into this complex biomedical subject and achieved consistent results within the range of 2.3% to 3.2% of annual self-recovery rate [1-6]
He used a quantitative approach with precision to discover and reconfirm his pancreatic beta cell’s health state by linking it backwards step-by-step with his collected data of glucose, weight, diet, and exercise. He has produced another dataset for a selfrepair rate of 2.7% which is located right in the middle between 2.3% and 3.2% from his previous findings.
In his opinion, type 2 diabetes (T2D) is no longer a non-reversible or non-curable disease. Diabetes is not only “controllable” but it is also “self-repairable”, even though at a rather slow rate. He would like to share his research findings and his persistent efforts from the past decade with his medical research colleagues and to provide encouragement to motivate other T2D patients like himself to reverse their diabetes conditions.
The author was inspired from reading two recently published medical papers regarding pancreatic beta cells insulin secretion or diabetes reversal via weight reduction. The weight reduction is directly related to the patient’s lifestyle improvement through diet and exercise. He has published six medical papers on beta cells based on different stages in observations of his continuous glucose improvements; therefore, in this article, he will investigate food ingredients, meal portions, weight, and glucose improvement based on his 10+ years of collected big data.
To learn more about his developed GH-Method: math-physical medicine (MPM) research methodology, readers can review his article, Biomedical research methodology based on GH-Method: math-physical medicine (No. 54 and No. 310), in Reference 1 to understand his MPM analysis method [7].
In 1995, the author was diagnosed with severe type 2 diabetes
(T2D). His daily average glucose reached 280 mg/dL with a peak
glucose at 398 mg/dL and his HbA1C was at 10% in 2010. Since
2005, he has suffered many kinds of diabetes complications,
including five cardiac episodes (without having a stroke), foot
ulcer, renal complications, bladder infection, diabetic retinopathy,
and hypothyroidism.
As of 9/30/2020, his daily average glucose is approximately 106
mg/dL and HbA1C at 6.1%. It should be mentioned that he started
to reduce the dosage of his three different diabetes medications
(maximum dosages) in early 2013 and finally stop taking them
on 12/8/2015. In other words, his glucose record since 2016 to
the present is totally “medication-free”.
Beginning on 1/1/2012, he started to collect his weight value in the early morning and his glucose values four times a day: FPG x1 in the early morning and PPG x3 at two hours after the first bite of each meal. Since 1/1/2014, he also started to collect his carbs/sugar amount in grams and post-meal walking steps. Prior to these two dates, especially during the period of 2010 to 2012, the manually collected biomarkers and lifestyle details were scattered and unorganized. Therefore, those annualized data from 2010 to 2012 or 2014 were guesstimated values with his best effort. It should be further mentioned that on 1/1/2013, he began to reduce his dosages of three diabetes educations step by step. By 1/1/2015, he was only taking 500 mg of Metformin for controlling his diabetes conditions. Finally, he completely ceased taking Metformin on 12/8/2015; therefore, since 1/1/2016, his body has been completely free of any diabetes medications.
Recently, a Danish medical research team has published an article on JAMA which emphasizes a strengthen lifestyle program can “reverse” T2D. This program includes a weekly exercise (5-6 times and 30-60 minutes each time), daily walking more than 10,000 steps using smart phone to keep a record, personalized diet and nutritional guidance by healthcare professionals, etc. The observed results from this Danish report are patients’ overall HbA1C reduction of 0.31%, and their diabetes medication dosage reduction from 73% to 26%
DiRECT research report from UK also indicated that an aggressive weight reduction program can induce improvement on diabetes conditions. This UK program includes low-calories diet for 3-5 months with 825-853 K-calories per day, plus daily walking of 15,000 steps per day. The observed results from this UK report are patients’ overall HbA1C reduction of 0.9%, weight reduction of 10 kg (or 22 lbs.), and reduced diabetes medication dosage as well.
Inspired by the results from the two European studies and based on his own collected big data over the past 10+ years, from 2010 to 2020, he decided to conduct a similar research on his own. He has separated his 10+ years data into two periods. The first period of 5 years, from 2010 to 2014, with partially collected and partially guesstimated data under different degrees of medication influence, and the second period of 6 years, from 2015 to 2020, with a complete set of collected raw data stored in software and sever without any medication influence.
His trend of thoughts include a sequence from cause to consequence as listed below from top to bottom:
1. Food and meal’s portion %
2. K-calories per day
3. Weight (lbs.)
4. FPG (mg/dL)
5. Carbs/sugar intake (grams)
6. Walking
7. PPG (mg/dL)
8. Daily glucose (mg/dL)
He has further conducted nine calculations of correlation
coefficient based on the above parameters to examine the degree
of connections between any 2 elements of these total 8 parameters.
It should be mentioned that the correlation coefficients can only
be done between two data sets, or two curves.
More importantly, in addition to examining the raw data, he also
placing an emphasis on the annual change rate percentage, its
trend, and their comparisons of these 8 parameters.
Figure 1 shows his background data table which includes his calculated annual averages of the 8 parameters plus proteins, fat, and daily K-calories, based on his daily data collected during 2010 to 2020.
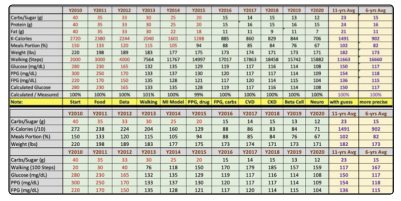
Figure 1: Background data table
Figure 2 depicts the annual change rate percentage of his food (meal portion %, K-calories, and carbs/sugar) and his weight. In this figure, meal portion and weight have similar change rates which means the less he eats, the lighter his weight. Also, carbs/ sugar amount and K-calories have similar change rates which means the less his K-calories, the less his carbs/sugar intake amount.
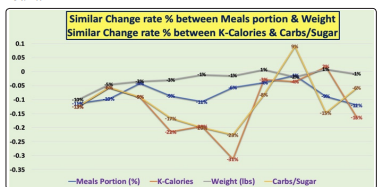
Figure 2: Annual change rates of Weight and Food (meal portion, K-calories, and carbs/sugar)
Figure 3 illustrates the similar trend of annual data of his weight and three food components (meal portion, K-calories, and carbs/ sugar amount).
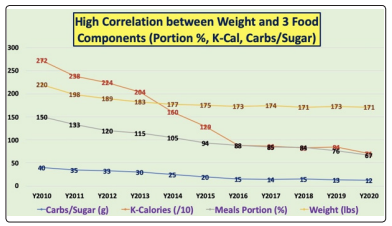
Figure 3: Annual change rates of Weight and Food (meal portion, K-calories, and carbs/sugar)
Exercise is a missing component from this figure which is also essential on weight reduction. The more he eats, the higher intake amounts of his K-calories and his carbs/sugar as well. During the past decade on his effort for weight reduction, he has focused on reducing both of his meal portion percentage and carb/sugar intake amount. As a result, he was able to reduce his weight from 220 lbs. (100 kg) and his average glucose from 280 mg/dL in 2010 to 171 lbs. (78 kg) and 106 mg/dL in 2020 (without any medication).
Figure 4 reflects the annual change rate percentage of his daily glucose, weight and carbs/sugar amount. In this figure, the change rates of his glucose and weight are remarkably similar, almost a mirror image, which indicates the lower his weight, the lower his glucose. This finding matches the two European studies and the common knowledge possessed by healthcare professionals. The reason for the obviously mismatched change rates between carbs/ sugar and glucose or weight is due to the missing component of exercise which is equally important on glucose reduction.
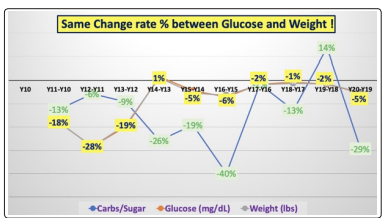
Figure 4: Annual change rates of Weight, Glucose, and Carbs/ sugar
Figure 5 focuses exclusively on the relationships among data of glucose, carbs/sugar, and exercise. The positive correlation coefficient between glucose and carbs/sugar is expressed by these two similar moving trends. On the other hand, the negative correlation coefficient between glucose and exercise (walking) is expressed by these two opposite moving trends.
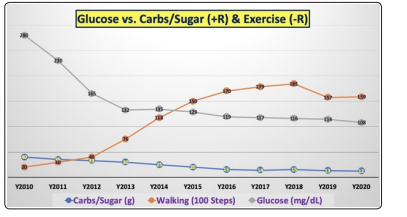
Figure 5: Annual data of Weight, Glucose, and Carbs/sugar
Figures 6, 7, and 8 collectively collective together to show the 9 sets of calculated correlation coefficients among those 8 listed elements in above section of Methods. A better illustration of these three figures can be found in a table, where all of the calculated correlations are above 90%, which means they are highly connected to each other (Figure 9). Even the correlation of -89% between glucose and walking exercise is also extremely high in a negative manner.
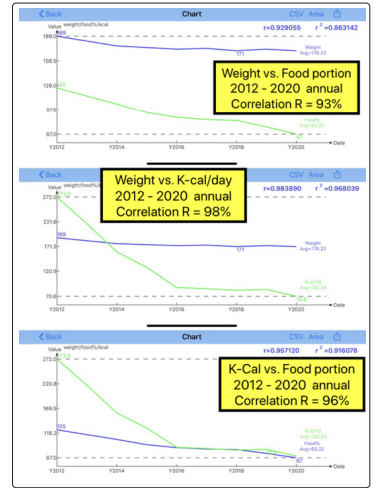
Figure 6: Correlation coefficients among Weight, K-calories, meal portion
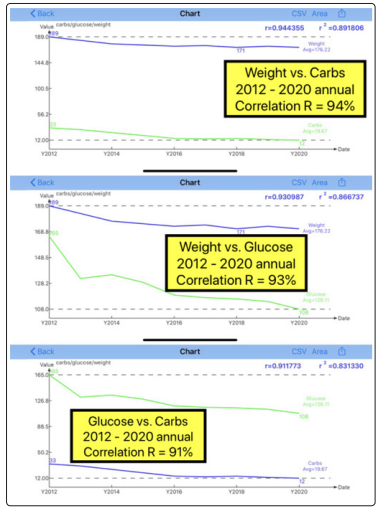
Figure 7: Correlation coefficients among Weight, Glucose, Carbs/ sugar
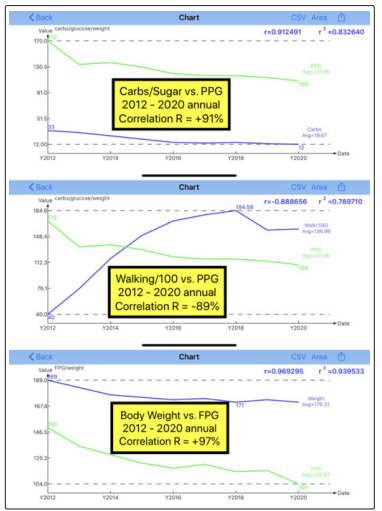
Figure 8: Correlation coefficients among PPG, Carb/sugar, Walking, FPG, Weight

Figure 9: A combined data table of 9 correlation coefficients among 8 elements
Figure 10 reveals the detailed annual change rates of 8 elements for a 10+ year period from 2010 to 2020. It should be pointed out that his average change rates within 6 years from 2015 through 2020 are 2.7% per year for both FPG and PPG, and 3.4% for daily glucose. This conclusion is similar to his six previously published papers regarding his pancreatic beta cell’s self-recovery rate of insulin secretion. Most likely, his beta cells insulin production and functionality have been repaired about 16% during the past 6 years or 27% during the past 10 years at a self-repair rate of 2.7% per year.

Figure 10: A combined data table of annual change rates of 7 elements, especially glucose change rates of 2.7%
1. His successful weight reduction, from 220 lbs. in 2010 to 171 lbs. in 2020, comes from his food portion reduction and exercise increase.
2. His lower carbs/sugar intake amount, from 40 grams in 2010 to 12 grams in 2020, is resulted from his learned food nutrition knowledge and meal portion reduction, from 150% in 2010 to 67% in 2020.
3. His weight reduction contributes to his FPG reduction, from 220 mg/dL in 2010 to 104 mg/dL in 2020. His carbs/sugar control and increased walking steps, from 2,000 steps in 2010 to ~16,000 steps in 202, have contributed to his PPG reduction, from 300 mg/dL in 2010 to 109 mg/dL in 2020. When both FPG and PPG are reduced, his daily glucose is decreased as well, from 280 mg/dL in 2010 to 108 mg/dL in 2020.
4. His damaged beta cell’s insulin production and functionality, most likely, have been repaired about 16% for the past 6 years or 27% in the past 10 years at a self-repair rate of 2.7% per year.
To date, the author has written seven papers discussing his pancreatic beta cell’s self-recovery of insulin secretion. In his first six papers (see References 2 through 7), he used several different “cutting angles” or “analysis approaches” to delve deeper into this complex biomedical subject and achieved consistent results within the range of 2.3% to 3.2% of annual self-recovery rate.
He used a quantitative approach with precision to discover and reconfirm his pancreatic beta cell’s health state by linking it backwards step-by-step with his collected data of glucose, weight, diet, and exercise. He has produced another dataset for a selfrepair rate of 2.7% which is located right in the middle between 2.3% and 3.2% from his previous findings.
In his opinion, type 2 diabetes (T2D) is no longer a non-reversible or non-curable disease. Diabetes is not only “controllable” but it is also “self-repairable”, even though at a rather slow rate. He would like to share his research findings and his persistent efforts from the past decade with his medical research colleagues and to provide encouragement to motivate other T2D patients like himself to reverse their diabetes conditions.
