Author(s): Maximiliano CL Rocca, N Chandra Wickramasinghe*, Gensuke Tokoro and Robert Temple
The majority of the pandemic influenza events of the last 450 years have occurred during periods of sunspot maxima. A review of this record suggests that there is a high probability that would have the next major influenza pandemic involving a new subtype of the virus ocurring during the next sunspot maximum (cycle 25) which is expected to occur during the years 2025 and 2026. We suggest strongly that preparatory action begins now, with a close monitoring of viral ingress into the stratosphere, as well as space weather monitoring using spacecraft resources.
The possible time-correlation between the influenza-A pandemics and the Sunspot cycle was extensively explored by Hope-Simpson and Hoyle and Wickramasinghe[1-4]. A causal link between the peaks of confirmed or probable influenza pandemics and peaks of the sunspot cycle appears at first sight to be strong, although later studies by Qu discuss cases where pandemics also occur closer to the troughs of the cycle in a few instances [5]. The majority of the pandemic influenza events of the last 450 years have occurred during Sunspot maxima.
We have recently shown the absence of any clear historical pandemic influenza events during the entire 17th century in amazing coincidence with the times of the Solar Maunder Minimum - period 1645-1715; during which no distinclty discernible Sunspot cycles occurred for some 70 years [6,7].
We are aware that any two time sequences of different events can show correlations over a few cycles and these are of course spurious. However, the situation for influenza and sunspots appears to be different. In Table 1 we present data relating to pandemic influenza (presumed type A) for the years 1550 to 2020 compared with sunspot cycle status at relevant dates. The historical influenza data was taken from several reviews[8-10]. The sunspot cycle information was taken from [11,12].
Table 1
| Dates of Pandemic Influenza | Sunspot Cycles Status |
|---|---|
| 1556-60 | Maximum |
| 1580 | Maximum |
| 1580 to 1729: NO PANDEMICS | Maunder Minimum: No Sunspot cycles: 1645-1715 |
| 1729-32 | Maximum |
| 1761 | Maximum of Solar Cycle number 1 |
| 1781-82 | Middle of Cycle 3 |
| 1830-33 | Maximum of cycle 7 |
| 1847-51 | Maximum of cycle 9 |
| 1889-90 | Minimum between cycles 12-13 |
| 1899-1900 | Minimum between cycles 13-14 |
| 1918-19 | Maximum of cycle 15 |
| 1957 | Maximum of cycle 19 |
| 1968 | Maximum of cycle 20 |
| 2009 | Minimum between cycles 23-24 |
We note that a total of 13 clear pandemic influenza type A events occurred in a period of 450 years. Of these 9 (70 %) occurred during sunspot maxima and 3 (20%) during sunspot minima. It is difficult to conclude that these correspondences are fortuitious. For sake of comparison we performed a similar analysis of the strongest volcanic eruptions and of the most powerful earthquakes (stronger than magnitude 8.0) for the same time interval. We found that a total of 10 powerful volcanic eruptions occurred during the period 1550-2000; of these 4 (40%) occurred during sunspot maxima, 3 (30%) during sunspot minima and 3 (30%) in the middle of a sunspot cycle [13].
For the case of earthquakes we found a total of 32 strong earthquakes (stronger than magntude 8.0) occurring during the period 1550-1990 [14]. Of these, 9 (28%) earthquakes occurred during sunspot maxima, 11 (34%) during minima and 12 (38%) in mid-cycle
The numbers of the above mentioned percentages show that correlated events of volcanic eruptions and very strong earthquakes vs Sunspot solar cycles are just random coincidences. There is no clear correlation between the dates of the most powerful volcanic eruptions/strong earthquakes and the status of the sunspot solar cycles.
On the contrary, the correlations between the dates of historical pandemic influenza type A events vs Sunspot cycles show a clear preference for sunspot maxima: 70% of the pandemic influenza events during the last 450 years occurred during sunspot maxima. This is a strong correlation pattern between pandemics and sunspot maxima and probably is not a random coincidence. As a consequence, we could reasonably expect a new influenza pandemic event to occur during the next maximum of the sunspot cycle (cycle 25). The current predictions of this cycle are shown in Fig 1 indicating a peak between 2023 and 2025 [15]. The fact that this peak follows the deepest sunspot minimum in over a 100 years should also be bourne in mind in making an assessment of what could be expected.
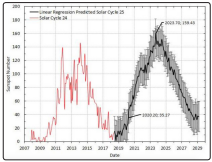
Figure 1: The predictions of cycle No.25 by Dani and Suliastiani showing a peak between 2023 and 2025
The question that is now raised is: what should we do? In a recent paper it was argued that a surviellance of the stratosphere for viral infall, as well as a close monitoring of the circulating virus at ground level will be fully justifified - both from what we know from past and on the basis of plausible models of space-driven pandemic events [15]. If new virions are introduced into the stratosphere from a cometary source/sources the early detection of a new subtype at say 50 km will give enough time before particles of viral sizes fall to ground level. In the event of a new virus or a mutated or recombined virus being detected in the stratosphere the settling time to ground level will give enough time for mitigation strategies to be put in place. Ground strategies could include checking resources for monitoring spread of the virus in the human population, providing hospital services (including intensive care if relevant) and in a longer term manufacturing appropriate vaccines as may be required.