Author(s): Sriram Pollachi Subburaman* and Srividhya Chandrasekaran
The evolution of distributed infrastructures, characterized by multiple components spread across networked computers that communicate and coordinate through message passing, has been significantly influenced by the imperative to attain exceptional Quality of Service (QoS). This pursuit of superior QoS is essential for fostering optimal Quality of Experience (QoE), driving notable advancements in distributed systems [1]. The advent of cloud computing ushered in the era of cloud-native development, where developers prioritize creating, deploying, and maintaining applications at hyper-scale over physical deployment locations [2,3]. This approach enables developers to focus entirely on continuous, agile software delivery, assuming that infrastructure is readily available. However, the rapid advancement of these paradigms is also causing a proliferation of new applications and services, stretching the capabilities of Ops teams to monitor and manage effectively. In recent years, the landscape of software architecture has undergone significant changes. One major change is the move away from large monolithic applications to smaller, more finely grained deployment units called microservices. These microservices communicate mostly through synchronous Representational State Transfer (REST) and asynchronous events, departing from the previous trend of larger and less flexible applications [4].
In static monolithic architecture, a database, UI and the backend are deployed as a single unit. Any change in the component, requires a build and deploy of entire application. In this case, the application developer is mainly responsible for collecting observability data
Contrastingly, microservices architecture organizes components as a set of loosely coupled services deployable independently and managed by Ops teams. As developers decompose applications into microservices, transporting them in containers across distributed cloud providers and consistently redeploying them under DevOps supervision, the demand for meticulous observability becomes increasingly imperative. The evolving techniques for designing and managing distributed systems underscore the importance of observing services and infrastructure to ensure seamless operations.
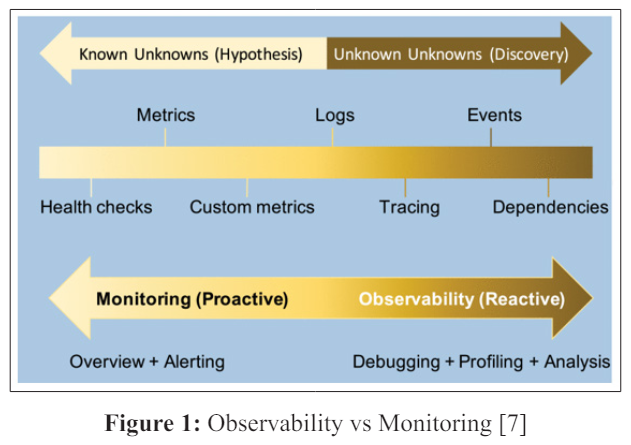
Observability is defined as a measure of how well the internal state of a system can be inferred from its external outputs [5]. Telemetry data, including logs, traces, and metrics, are key external outputs for distributed systems like microservices. They encompass details such as machine resource usage and application-generated loglevel data. Observability offers both high-level system health overviews and detailed insights into implicit failure modes.
Monitoring is the process of collecting data and generating reports on different metrics that define system health monitoring and observability are often discussed together as they both contribute to maintaining system reliability [6]. While they share a common goal, there exists a nuanced difference between them, and they are, in fact, interconnected. To put it simply, observability does not replace monitoring, nor does it render monitoring unnecessary; rather, they complement each other and work in tandem. Monitoring notifies operators of operational failures, while observability helps identify the location, cause, and trigger of the failure.
Monasca an open-source monitoring service, seamlessly integrates with OpenStack. It is designed to be multi-tenant, scalable, and fault-tolerant, providing a Representational State Transfer (RESTful) API for efficient metrics processing and querying. Additionally, it offers streaming alarm and notification engines [8]. Another widely used tool is Open Telemetry, employed to collect telemetry data from cloud-native applications and their underlying infrastructure. This enables the monitoring of their overall health and performance. Grafana Labs contributes an open-source monitoring and observability platform that facilitates querying, viewing, and alerting based on metrics [9,10]. The ELK stack, comprising Elasticsearch, Logstash, and Kibana, provides centralized logging, aiding in the discovery of application issues from a unified location [11].
For microservices monitoring, Apache Skywalking is an opensource observability tool engineered to assist operators in identifying issues, receiving critical alerts, and monitoring system health. Consul, a service mesh solution, offers a comprehensive control plane, encompassing service discovery, configuration, and segmentation capabilities [12,13]. Cilium, an open-source solution based on extended Berkeley Packet Filter (eBPF) technology, ensures secure network connectivity between services deployed on Linux container management platforms such as Docker and Kubernetes [14].
Prometheus, a Cloud Native Computing Foundation (CNCF) project, is a system that provides multi-dimensional time-series monitoring for resources and services. It collects metrics, evaluates rules, displays results, and issues alerts [15].
Among cloud-based vendors, Microsoft Azure Monitor collects and analyzes telemetry data from Azure and on-premises environments [16]. It monitors web application availability, performance, usage, and optimizes infrastructure performance. Amazon CloudWatch is utilized for monitoring AWS resources and applications, offering visibility into resource utilization, application performance, and operational health across the entire stack, from applications to supporting infrastructure [17]. Google Cloud Operations Suite encompasses various components such as Cloud Monitoring, Cloud Trace, and Cloud Logging, covering multiple observability dimensions [18].
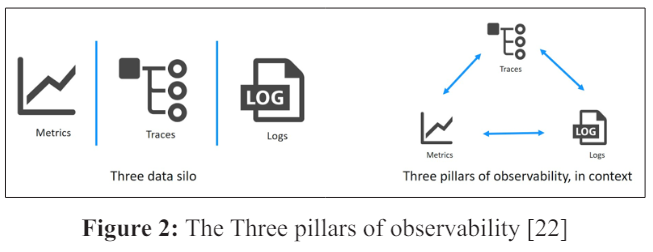
The three important observability data types are logs, metrics, and traces. Logs comprise structured and unstructured text lines generated by a system during the execution of specific code segments. Log monitoring is emphasized in [19]. Metrics are numeric representations of data utilized by Ops teams to assess the long-term behavior of a system, service, or network component. Metrics monitoring is emphasized in [20]. Traces illustrate the complete path of a request or action as it traverses different components within a distributed system. Trace monitoring is emphasized in [21].
Identify the potential anomaly from other anomalies. For instance, a modern observability system should collect and analyze data every second, presenting correlated information alongside anomalies for users to quickly identify potential root causes of issues.
With the dependency graphs in the tools, the system should be able to inject the right instrumentation automatically.
The observability system should handle the issues dynamically. Granularity is a key characteristic of an observability system.
When operators review metrics regarding the health of a microservice, they should be capable of observing its impact on other services or components within the distributed system, as well as how those workloads are influenced by the Kubernetes cluster hosting them, and vice versa.
Imagine accessing all telemetry data in a single, near real-time view from any location. This innovative design should provide intuitive visualizations, requiring no configuration, enabling Ops teams to efficiently navigate large, intricate, distributed systems, and promptly identify and prioritize performance issues.
This involves storing, alerting, and analyzing telemetry data using cohesive APIs, regardless of its distributed placement across multiple nodes in an edge cluster. Typically, operators seek a platform capable of ingesting metrics, events, logs, and traces from various sources, including proprietary and open-source agents, APIs, and built-in instrumentation. However, accessing data through such unified APIs must be scalable to accommodate high ingest loads during peak periods.
Separate data sources from destinations: By decoupling sources and sinks, it should be simple to introduce or modify tools and redirect data without affecting production systems. For example, integrating a messaging bus into the observability system should fully separate the source and sink, eliminating direct interaction between them.
Based on the observability requirements and some of the best practices, we summarize some of the challenges in building observability tools concerning cloud architecture [23].
Microservice architecture presents unique observability challenges due to its distributed nature. Each microservice operates on an isolated computing platform, such as a container, leading to interdependencies. Failures in one microservice can cascade throughout the system, impacting overall functionality. Therefore, beyond internal observability, understanding complex relationships among microservices is essential for a comprehensive view of the deployed system [24].
Serverless platforms, typically furnish basic dashboards to monitor ongoing processes. However, these dashboards have limited capabilities, such as workload visualization and resource utilization reports, as they lack root access to the underlying operating system, making installation and configuration of additional observability tools impossible [25].
Collecting and analyzing telemetry from distributed containers is challenging, especially considering the dynamic nature of container deployments. Therefore, practitioners often prefer observability solutions integrated with container orchestration platforms like Kubernetes [26].
Analyzing the diverse observability data poses challenges, requiring cleaning, formatting, and cross-referencing with time as the common factor.
Merging logs, metrics, and traces gathered from infrastructure components like networks, servers, VMs, containers, and serverless functions with other telemetry such as application and OS data is essential for obtaining a comprehensive view. The complexities of infrastructure monitoring have been addressed in our prior research [27,28].
This paper has explored various strategies for achieving comprehensive observability in both applications and infrastructure within modern software systems. By leveraging a combination of traditional monitoring techniques and emerging technologies such as distributed tracing and service mesh architectures, organizations can enhance their operational visibility and troubleshooting capabilities. Through practical case studies and implementation guidelines, we have demonstrated the importance of observability in ensuring the reliability and performance of software systems in diverse environments. Moving forward, continued research and adoption of observability best practices will be essential for meeting the evolving needs of complex and dynamic software ecosystems [29].